 Click™

A Cool Click for Evidence-based Medicine (EBM) and Evidence-based Practice (EBP) Commentaries & Health Care Quality Improvement Nibblets
The EBM Information Quest: Is it true? Is it useful? Is it usable?™
Valdity Detectives: Michael E Stuart MD, President & Medical Director . Sheri Ann Strite, Managing Director & Principal

Why Critical Appraisal Matters


DelfiniClick™Evidence & Quality Improvement Commentaries |
Follow & Share...
Just-in-time Updates![]()
Like Us ![]() Find Us
Find Us![]()
Volume
— Quality
of Evidence: Newest 10/06/2014: Comparison of Risk of Bias Ratings in Clinical Trials—Journal Publications Versus Clinical Study Reports 01/14/2014: Attrition Bias Update Go to Contents
|
||||||||||||||||||||||||||||||||
| Quality
of Studies: Lower Quality = Greater Effect Size
The quality of studies in systematic reviews and meta-analyses has repeatedly been shown to affect the amount of benefit reported. This DelfiniClick is a quick reminder that just because a study is a RCT does not mean it will provide you with a reliable estimate of effect size. A nice illustration of this point is provided in a classic article by Moher D et al. (Does quality of reports of randomised trials affect estimates of intervention efficacy reported in meta-analyses? Lancet 1998; 352: 609–13)[1]. In this study, the authors randomly selected 11 meta-analyses that involved 127 RCTs on the efficacy of interventions used for circulatory and digestive diseases, mental health, pregnancy and childbirth. The authors evaluated each RCT by examining the description of randomization, allocation concealment, blinding, drop outs and withdrawals. The results are in line with other authors’ findings regarding quality of methods and amount of benefit (effect size) reported as relative measures below:
The authors conclude that studies of low methodological quality in which the estimate of quality is incorporated into the metaanalyses can alter the interpretation of the benefit of the intervention. We continue to see this problem in systematic reviews and clinical guidelines and suggest that when evaluating secondary studies readers pay close attention to the quality of included studies. [1] Moher D, Pham B, Jones A, Cook DJ, Jadad AR, Moher M, Tugwell P, Klassen TP. Does quality of reports of randomised trials affect estimates of intervention efficacy reported in meta-analyses? Lancet. 1998 Aug 22;352(9128):609-13. PubMed PMID: 9746022.
|
||||||||||||||||||||||||||||||||
Overestimation
of Effect Size in Studies of Low Quality In a previous DelfiniClick, we summarized an article by Moher and colleagues (1) in which the authors randomly selected 11 meta-analyses involving 127 RCTs which evaluated the efficacy of interventions used for circulatory and digestive diseases, mental health, pregnancy and childbirth. Moher and colleagues concluded that -
Below we summarize another study that confirms and expands Moher’s findings. In a study similar to Moher’s, Kjaergard and colleagues (2) evaluated the effects of methodologic quality on estimated intervention effects in randomized trials. The study evaluated 23 large and 167 small randomized trials and a total of 136,164 participants. Methodologic quality was defined as the confidence that the trial’s design, conduct, analysis, and presentation minimized or avoided biases in the trial’s intervention comparisons (3). The reported methodologic quality was assessed using four separate components and a composite quality scale. The quality score was ranked as low (</=2points) or high (>/=3 points), as suggested by Moher et al. (1). The four components were 1) generation of allocation sequence; 2) concealment of allocation; 3) double-blinding; and, 4) reporting of loss-to-follow-up: RESULTS OF KJAERGARD ET AL’S REVIEW (all reported exaggerations are relative increases): Generation
of Allocation Sequence Concealment
of Allocation Double
Blinding Reporting
of Loss-to-Followup Kjaergard and Colleagues’ Conclusions
Delfini Comment Previous studies have questioned the reliability of reported losses to follow-up (5, 6). In accordance with Schulz and colleagues’ results (5), the authors found no association between intervention effects and reported follow-up. In agreement with the findings of Moher and associates (1,3) and Juni and colleagues (7), the authors found that trials with a low quality score on the scale developed by Jadad and colleagues (8) significantly exaggerate intervention benefits. Kjaergard and colleagues conclude that assessment of methodologic quality should focus on generation of allocation sequence, allocation concealment, and double blinding. Delfini feels this is not sufficient – but appreciates this study as one that further demonstrates the importance of effective approaches to some of these methodologic areas. References 2. Kjaergard LL, John Villumsen J, Gluud C. Reported Methodologic Quality and Discrepancies between Large and Small Randomized Trials in Meta-Analyses. Ann Intern Med. 2001;135:982-989. PMID 11730399 3. Moher D, Cook DJ, Jadad AR, Tugwell P, Moher M, Jones A, et al. Assessing the quality of reports of randomised trials: implications for the conduct of meta-analyses. Health Technol Assess. 1999;3:i-iv, 1-98. PMID: 10374081 4. Emerson JD, Burdick E, Hoaglin DC, Mosteller F, Chalmers TC. An empirical study of the possible relation of treatment differences to quality scores in controlled randomized clinical trials. Control Clin Trials. 1990;11:339-52. PMID: 1963128 5. Schulz KF, Chalmers I, Hayes RJ, Altman DG. Empirical evidence of bias. Dimensions of methodological quality associated with estimates of treatment effects in controlled trials. JAMA. 1995;273:408-12. PMID: 7823387 6. Gøtzsche PC. Methodology and overt and hidden bias in reports of 196 double-blind trials of nonsteroidal antiinflammatory drugs in rheumatoid arthritis. Control Clin Trials. 1989;10:31-56. PMID: 2702836 7. Juni P, Witschi A, Bloch R, Egger M. The hazards of scoring the quality of clinical trials for meta-analysis. JAMA. 1999;282:1054-60. PMID: 10493204 8. Jadad AR, Moore RA, Carroll D, Jenkinson C, Reynolds DJ, Gavaghan DJ, et al. Assessing the quality of reports of randomized clinical trials: is blinding necessary? Control Clin Trials. 1996;17:1-12. PMID: 8721797
|
||||||||||||||||||||||||||||||||
5 “A”s of Evidence-based Medicine & PICOTS: Using “Population, Intervention, Comparison, Outcomes, Timing, Setting” (PICOTS) In Evidence-Based Quality Improvement Work Much of what we do when answering key clinical questions can be summarized using the 5 “A” EBM Framework—Ask, Acquire, Appraise, Apply and "A"s Again.[1] Key clinical questions create the focus for the work and, once created, drive the work or project. In other words, the 5 “A”s form a scaffolding for us to use in doing EB quality improvement work of many types. When healthcare professionals look to the medical literature for answers to various clinical questions or when planning comparative reviews, they frequently utilize checklists which employ the mnemonics, PICO (population, intervention, comparison, outcome)[2], PICOTS (same as PICO with the addition of timing and setting) or less frequently PICOT-SD (which also includes study design.[3] PICOTS (patient population, intervention, comparison, outcomes, timing and setting) is a checklist that can remind us of important considerations in all of the 5 "A" areas. PICOTS in Forming Key Clinical Questions and Searching PICOTS is a useful framework for constructing key questions, but should be applied thoughtfully, because at times all PICOTS elements are not needed to construct a useful clinical question. For example, if I am interested in the evidence regarding prevention of venous thromboembolism in hip replacement surgery, I would want to include the population and study design and perhaps key outcomes, but I would not want to limit the question to any specific interventions in case there are some useful interventions of which I am not aware. So the question might be, “What is the evidence that thromboembolism or deep vein thrombosis (DVT) prophylaxis with various agents reduces mortality and clinically significant morbidity in hip replacement surgery?” In this case, I was somewhat specific about P (the patient population—which frequently is the condition of interest—in this case, patients undergoing hip replacement surgery), less specific about O (mortality and morbidities) and not specific about I and C. I could be even more specific about P if I specified patients at average risk for VTE or only patients at increased risk. If I were interested in the evidence about the effect of glycemic control on important outcomes in type II diabetes, I might pose the question as, “What is the effect of tight glycemic control on various outcomes,” and type in the terms “type 2 diabetes” AND “tight glycemic control” which would not limit the search to studies reporting outcomes of which I was unaware. Learners are frequently taught to use PICO when developing search strategies. (When actually conducting a search, we use "condition" and not "population" because the condition is more likely to activate the MeSH headings in PubMed which produces a search with key synonyms.) As illustrated above, the PICO elements chosen for the search should frequently be limited to P (the patient population or condition) and I so as to capture all outcomes that have been studied. Therefore, it is important to remember that many of your searches are best done with using only one or two elements and using SD limits such as for clinical trials in order to increase the sensitivity of your search. PICOTS in Assessing Studies for Validity and Synthesizing Evidence When critically appraising studies for reliability or synthesizing evidence from multiple studies, PICOTS reminds us of the areas where heterogeneity is likely to be found. PICOTS is also useful in comparing the relevance of the evidence to our population of interest (external validity) and in creating decision support for various target groups. PICOTS in Documenting Work Transparency can be made easier by using PICOTS when documenting our work. You will notice that many tables found in systematic reviews and meta-analyses include PICOTS elements. References 1. Modified by Delfini Group, LLC (www.delfini.org) from Leung GM. Evidence-based practice revisited. Asia Pac J Public Health. 2001;13(2):116-21. Review. PubMed PMID: 12597509. 2. Guyatt GH, Oxman AD, Kunz R, Atkins D, Brozek J, Vist G, Alderson P, Glasziou P, Falck-Ytter Y, Schünemann HJ. GRADE guidelines: 2. Framing the question an deciding on important outcomes. J Clin Epidemiol. 2011 Apr;64(4):395-400. Epub 2010 Dec 30. PubMed PMID: 21194891. 3. Methods Guide for Effectiveness and Comparative Effectiveness Reviews. AHRQ Publication No. 10(12)-EHC063-EF. Rockville, MD: Agency for Healthcare Research and Quality. April 2012. Chapters available at: www.effectivehealthcare.ahrq.gov.
|
||||||||||||||||||||||||||||||||
Comparison of Risk of Bias Ratings in Clinical Trials—Journal Publications Versus Clinical Study Reports Many critical appraisers assess bias using tools such as the Cochrane risk of bias tool (Higgins 11) or tools freely available from us (http://www.delfini.org/delfiniTools.htm). Internal validity is assessed by evaluating important items such as generation of the randomization sequence, concealment of allocation, blinding, attrition and assessment of results. Jefferson et al. recently compared the risk of bias in 14 oseltamivir trials using information from previous assessments based on the study publications and the newly acquired, more extensive clinical study reports (CSRs) obtained from the European Medicines Agency (EMA) and the manufacturer, Roche. Key findings include the following:
The authors discuss the idea that the risk of bias tools are important because they facilitate the process of critical appraisal of medical evidence. They also call for greater availability of the CSRs as the basic unit available for critical appraisal. Delfini Comment We believe that both sponsors and researchers need to provide more study detail so that critical appraisers can provide more precise ratings of risk of bias. Study publications frequently lack information needed by critical appraisers. We agree that CSRs should be made available so they can be used to improve their assessments of clinical trials. However, our experience has been the opposite of that experienced by the authors. When companies have invited us to work with them to assess the reliability of their studies and made CSRs available to us, frequently we have found important information not otherwise available in the study publication. When this happens, studies otherwise given a rating at higher risk of bias have often been determined to be at low risk of bias and of high quality. References 1. Higgins JP, Altman DG, Gøtzsche PC, Jüni P, Moher D, Oxman AD, Savovic J, Schulz KF, Weeks L, Sterne JA; Cochrane Bias Methods Group; Cochrane Statistical Methods Group. The Cochrane Collaboration's tool for assessing risk of bias in randomised trials. BMJ. 2011 Oct 18;343:d5928. doi: 10.1136/bmj.d5928. PubMed PMID: 22008217. 2. Jefferson T, Jones MA, Doshi P, Del Mar CB, Hama R, Thompson MJ, Onakpoya I, Heneghan CJ. Risk of bias in industry-funded oseltamivir trials: comparison of core reports versus full clinical study reports. BMJ Open. 2014 Sep 30;4(9):e005253. doi: 10.1136/bmjopen-2014-005253. PubMed PMID: 25270852.
|
||||||||||||||||||||||||||||||||
Must
Clinical Trials be Randomized? A Look at Minimization Methods In clinical trials, any difference between groups, except for what is being studied, could explain or distort the study results. In randomized clinical trials (RCTs), the purpose of randomization is to attempt to distribute people for study into study groups in such a way that prognostic variables are evenly distributed. Thus, the goal of the randomization process in RCTs is to generate study groups with similar known and unknown prognostic variables so that the groups being compared have similar baseline characteristics. Randomization is very likely to achieve balanced groups, especially in large trials. Adequate simple or unrestricted randomization is achieved by generating random number sequences and concealing the randomization process from everyone involved in the study. Minimization is a non-random method of allocating patients to study groups. Since it is not random, is it necessarily bad? Possibly not. With minimization the goal is to ensure that several pre-specified patient factors and the number of subjects are balanced in the study groups. The allocation of each subject is identified, and that information is used to increase the likelihood that subjects are allocated to the group which it is thought will result in balanced prespecified patient factors. This can be accomplished by models that identify the the number of patients in each group with the pre-specified factors and increase the likelihood or ensure that the next subject will be allocated to the group with fewer patients with the pre-specified factor. Numerous methods for accomplishing minimization have been described. Minimization may effectively distribute known prognostic variables, and many authors consider it methodologically equivalent to randomization without minimization. One potential threat to validity is whether or not the knowledge of impending allocation assignment by individuals involved in the study could affect the allocation process. Benefits, drawbacks and extensive methodological detail are available in a review by Scott et al. who conclude that minimization is a highly effective allocation method [1]. 1. Scott NW, McPherson GC, Ramsay CR, Campbell MK. The method of minimization for allocation to clinical trials. a review. Control Clin Trials. 2002 Dec;23(6):662-74. Review. PubMed PMID: 12505244
|
||||||||||||||||||||||||||||||||
Advice On Some Quasi-Experimental Alternatives To Randomization We have found a lot of help over the years in reading the advice and postings of statistician, Dr. Steve Simon. Here’s an entry in which he discusses some considerations when dealing with quasi-experimental designs. You can sign up for his newsletter to receive it directly. (Note: if you keep reading to the next entry about how much in practice is estimated to be evidence-based, we suspect that the reported percent might be inflated if the reviewers were not applying a solid critical appraisal approach.) You can read Steve’s advice about quasi-experimental design considerations here: http://www.pmean.com/news/201201.html#1
|
||||||||||||||||||||||||||||||||
| Concealment
of Allocation
In 1996, the CONSORT statement encouraged the reporting of concealment of allocation. Concealment of allocation is the process for actually assigning to the patient the group they will be in without breaking blinding. Hewitt et al. in a recent issue of BMJ reviewed the prevalence of adequate concealment of allocation in 4 journals—BMJ, Lancet, JAMA and NEJM (Hewitt C et al. BMJ 2005;330:1057-1058. PMID: 15760970). They scored the allocation as adequate (i.e., subject recruiter was different person from the person executing the allocation sequence), inadequate or unclear. Sealed envelopes were considered inadequate unless performed by an independent third party. Results Delfini Commentary This is another study suggesting that the critical appraisal of RCTs is “critical” and that lower quality studies are more likely to report significant benefit than are higher quality studies.
|
||||||||||||||||||||||||||||||||
|
A recent article, Boutron I, Estellat C, Guittet L, Dechartres A, Sackett DL, et al. (2006) Methods of blinding in reports of randomized controlled trials assessing pharmacologic treatments: A systematic review. PLoS Med 3(10): e425. DOI: 10.1371/ journal.pmed.0030425, provides a great deal of useful information about and a way of classifying blinding in research studies. The authors evaluated blinding in RCTs of pharmacologic treatment published in 2004 in high impact-factor journals. The following are some key points from the article: • The authors
identified 819 reports with about 60% describing the method
of blinding. The classification identified three main methods
of blinding: • ESTABLISHING BLINDING OF PATIENTS AND PROVIDERS: 472 [58%] described the method of blinding, but 236 [29%] gave no detail and 111 [13%] some data on blinding (i.e., reporting that treatments were similar or the use of double dummies with no description of the method). The methods of blinding identified varied in complexity. The authors reported use of a centralized preparation of similar capsules, tablets, or embedded treatments in hard gelatin capsules (193/336 [57%]), similar syringes (37/336 [11%]), or similar bottles (38/336 [11%]). Use of a double dummy procedure was described in 79 articles (23%). Other methods consisted of a sham intervention performed by an unblinded health care provider who was not actively involved in the care of patients and had no other contact with patients or other caregivers and outcome assessors (17/336 [5%]). To mask the specific taste of the active treatments, in ten articles researchers used a specific flavor such as peppermint or sugar to coat treatments. For treatments administered by care providers, authors reported use of a centralized preparation of opaque coverage to adequately conceal intravenous treatments with different appearances (14/336 [4%]). • AVOIDING UNBLINDING OF PATIENTS AND PROVIDERS: Only 28/819 [3%]) reported methods to avoid unblinding. Methods to blind dosage adaptation relied on use of a centralized adapted dosage or provision of sham results of complementary investigations for treatments necessitating dosage adaptation. Methods to avoid unblinding because of side effects relied mainly on centralized assessment of side effects, partial information to patients about side effects, use of active placebo or systematic prevention of adverse effects in both arms. • BLINDING ASSESSORS: These methods depend on the main outcomes and are particularly important when blinding cannot be established and maintained by the methods described above. A total of 112 articles [14%] described these methods, which relied mainly on a centralized assessment of the main outcome. Blinding of outcome assessors is presumably achieved if neither patients nor those involved in the trial have any means to discover which arm a patient is in, for example because the placebo and active drugs are indistinguishable and allocation is via a central randomization service. 96 reports (86%) of the 112 reports in which specific measures to blind the outcome assessor were reported concern trials in which patients were reported as blinded or in which double blinding or triple blinding was reported. These results suppose that, although blinding was performed at an earlier stage, the investigators nevertheless decided to perform a specific method of blinding the outcome assessor. • AUTHORS
COMMENTS AND CONCLUSIONS: • The study results might be explained in part by the insufficient coverage of blinding in the Consolidated Standards for Reporting Trials (CONSORT) statements. For example, three items of the CONSORT statements are dedicated to the description of the randomization procedure, whereas only one item is dedicated to the blinding issue. The CONSORT statements mainly focus on reporting who is blinded and less on the reporting of details on the method of blinding, and this information is essential to appraise the success of blinding. • Some evidence suggests that although participants are reported as blinded, the success of blinding might be questionable. For instance, in a study assessing zinc treatment for the common cold, the blinding procedure failed, because the taste and aftertaste of zinc was distinctive. And yet, tools used to assess the quality of trials included in meta-analyses and systematic reviews focus on the reporting of the blinding status for each participant and rarely provide information on the methods of blinding and the adequacy of the blinding method. • There is a need to strengthen the reporting guidelines related to blinding issues, emphasizing adequate reporting of the method of blinding. Delfini Commentary
A number of studies have shown that lack of blinding is associated with inflated treatment effects. In some cases blinding may not be possible. For example, side effects or taste may result in unblinding. The important point is that even if blinding is not possible, the investigators do not get “extra” validity points for doing the best they could (i.e., the study should not be “upgraded”).
|
||||||||||||||||||||||||||||||||
Blinding and Objective Outcomes We provide some general references on blinding at Recommended Reading. A frequent question (or assumption) that we hear concerns lack of blinding and objective outcomes such as mortality. There appears to be a consensus that lack of blinding can distort subjective outcomes. However, there also appears to be a belief that lack of blinding is not likely to distort hard outcomes. We are not so sure. In reviewing the literature on blinding, we find only one reference that actually attempts to address this question. Wood et al. found little evidence of bias in trials with objective outcomes.[1] Yet, as we know, absence of evidence is not evidence of absence. Therefore, anything that contradicts these findings raises the specter that we are not “distortion-free” when it comes to lack of blinding and hard outcomes. The RECORD trial is an interesting case in point. Caregivers were not blinded, but adjudication was. However, Psaty and Prentice point out that it appears that it is possible that lack of blinding might have affected which cases were submitted to adjudication, potentially causing a meaningful change in outcomes.[2] We wrote a letter in response that pressed even further for the importance of blinding.[3] You can read more about this particular case in the DelfiniClick that immediately follows below. A classic study is Chalmers’ review of the effect of randomization and concealment of allocation on the objective outcome, mortality, in 145 trials of interventions for acute myocardial infarction.[4] Although this study did not focus on blinding beyond the concealment phase of studies, it may help shine some light on this area. Chalmers showed (and others confirmed later) that lack of effective allocation concealment is associated with changes in study results. It is also possible that lack of blinding of patients and investigators in studies with objective outcome measures can affect patient management and patient experiences, thereby distorting results. In Salpeter et al. a meta-analysis of hormone replacement therapy, mortality was an outcome of interest.[5] The trials were analyzed by mean age of women in the trials (creating one of several serious threats to validity), to create a “younger women” and an “older women” analysis set. No benefit was shown in the “older women” trials, but benefit was shown in the “younger women” set. Interestingly, many of the studies in the younger women group were open-label, but none were open-label in the older women group. Although clearly not proof, this is intriguing and potentially suggestive of a distorting effect of non-blinding in studies with objective outcome measures. To us, irrespective of any hard evidence of the impact of lack of blinding on hard outcomes, the fact that a distortion is possible, is of concern. If it is true that clinicians’ interventions can have an impact on mortality, then it is entirely possible that knowing which treatment a patient is receiving could have an impact on mortality outcomes. We know that the placebo effect is real. A patient’s knowledge of his or her treatment could be impacted by that effect and/or by a change in behaviors on the part of clinicians, investigators, patients or others involved in clinical trials, and that could affect a hard outcome such as mortality. As critical appraisers we want to know— 1. Wood L, et al. Empirical evidence of bias in treatment effect estimates in controlled trials with different interventions and outcomes: meta-epidemiological study. BMJ. 2008 Mar 15;336(7644):601-5. Epub 2008 Mar 3. PubMed PMID: 18316340. 2. Psaty BM, Prentice RL. Minimizing bias in randomized trials: the importance of blinding. JAMA. 2010 Aug 18;304(7):793-4. PubMed PMID: 20716744. [See below for DelfiniClick on this study.] 3. Strite SA, Stuart ME. Importance of blinding in randomized trials. JAMA. 2010 Nov 17;304(19):2127-8; author reply 2128. PubMed PMID: 21081725. 4. Chalmers TC et al. Bias in Treatment Assignment in Controlled Clinical Trials. N Engl J Med 1983;309:1358-61. PMID: 6633598. 5. Salpeter SR, et al. Mortality associated with hormone replacement therapy in younger and older women. J Gen Intern Med July 2004;19:791-804. PMID: 15209595
|
||||||||||||||||||||||||||||||||
Open-Label Trials and Importance of Blinding (Even with Hard Outcomes) One of our heroes is Dr. Bruce Psaty, a brilliant and dedicated University of Washington researcher Sheri worked with years ago during her stint at the Group Health Cooperative Center for Health Studies (now retitled, Group Health Research Institute). Bruce does some really interesting and important work, and frequently his efforts add to our collection of cases for critical appraisal training. In a recent issue of JAMA, he and Dr. Ross Prentice, a statistician and leader at Fred Hutchinson Cancer Research Center, address, “Minimizing Bias in Randomized Trials: The Importance of Blinding.”[1] They explore the “prospective randomized open trial with blinded endpoints,” and examine other evidence supporting the importance of investigator-blinding in clinical trials. In their commentary, they examine the RECORD trial (Rosiglitazone Evaluated for Cardiac Outcomes and Regulation of Glycemia in Diabetes) which was an open-label trial with blinded assessment. They report that it was determined that event rates for myocardial infarction in the control group were unexpectedly low, and they summarize some findings from an independent review by the FDA which identified myriad problems with case report forms created prior to any blind assessment. The FDA review resulted in a re-analysis, using the available readjudicated case information, with the end result that the outcome of non-significance for risk of MI in the original study report changed to a statistically significant difference, the results of which were reported to be “remarkably close to results” reported in the original meta-analysis that raised concerns about rosiglitazone and cardiovascular risk.[2] In our letter to JAMA,[3] we express that Drs. Psaty and Prentice add to evidence on the importance of blinding, and we raise some points to carry this further, including an example specific to the commentary, that addresses potential for unbalancing study groups. We want to expand upon this to make two basic key points: 1. As a general principle, nondifferential errors between treatment groups can, in fact, systematically bias summary measures. Example: Inaccurate measuring instruments equally applied. What if a question on a survey instrument fails to capture an outcome of interest? It might show no difference between groups, when a true difference actually exists. 2. Nondifferential errors may be nondifferential in appearance only. Missing data are a case in point. Missing data points are frequent problems in clinical trials. Some reviewers are unconcerned by missing data provided that the percent of missing data is balanced between groups. We disagree. Just because data may be missing in equal measure doesn’t mean that a distortion of results has not occurred. In our letter, we also point out that unblinded investigators may treat patients differently, which is a performance bias. Patients with differing care experiences could have dramatically different outcomes, including myocardial infarction, in keeping with the RECORD study example. We are grateful to Drs. Psaty and Prentice for their work and agree that they have put a greater spotlight on “likely important departures from the crucial equal outcome ascertainment requirement under open-label trial designs.”[1] We hope from their work and our letter that people will increasingly see the important role blinding plays in clinical trial design and execution.
2. Nissen SE, Wolski K. Effect of rosiglitazone on the risk of myocardial infarction and death from cardiovascular causes. N Engl J Med. 2007 Jun 14;356(24):2457-71. Epub 2007 May 21. Erratum in: N Engl J Med. 2007 Jul 5;357(1):100.. PubMed PMID: 17517853. 3. Strite SA, Stuart ME. Importance of Blinding in Randomized Trials: To the Editor. JAMA. 2010 Nov 17;304(19):2127-8.
|
||||||||||||||||||||||||||||||||
| Blinding In Surgical Trials — It is Through Blinding
We Become Able To See 11/17/2010 Blinding is an important consideration when evaluating a study. Without blinding, the likelihood of bias increases. Bias occurs when patients in one group experience care or exposures not experienced by patients in the other group(s), and the differences in care affect the study outcomes.Lack of blinding may be a major source of this type of bias in that unblinded clinicians who are frequently “rooting for the intervention” may behave differently than blinded clinicians towards patients whom they know to be receiving the study drug or intervention being studied. The result is likely to be that in unblinded studies, patients may receive different or additional care. Unblinded subjects may be more likely to drop out of a study or seek care in ways that differ from blinded subjects. Unblinded assessors may also be “rooting for the intervention” and assess outcomes differently from blinded assessors. How much difference does blinding make? Jüni et al. reviewed four studies that compared double blinded versus non-blinded RCTs and attempted to quantify the amount of distortion (bias) caused by lack of double blinding [1]. Overall, the overestimation of effect was about 14%. The largest study reviewed by Juni assessed the methodological quality of 229 controlled trials from 33 meta-analyses and then analyzed, using multiple logistic regression models, the associations between those assessments and estimated treatment effects [2]. Trials that were not double-blind yielded on average 17% greater effect, 95% CI (4% to 29%), than blinded studies (P = .01).
Flum goes on to present multiple examples of the power of suggestion and the problem of doing non-blinded trials in the field of surgery. Observational trials have often reported procedural success, but sham-controlled trials for the same conditions demonstrate how much of that success is due to the placebo effect.
Delfini Commentary
The SPORT trial draws attention to the problem of non-blinding in surgical trials. This was a very expensive, labor-intensive study that provides no useful efficacy data. Research subjects were undoubtedly told this study would provide answers regarding the relative efficacy of surgery vs conservative care for lumbar spine disease. The authors of the SPORT trial state that a sham-controlled trial was impractical and unethical, possibly — according to Flum — because the risk of the sham would include general anesthesia (to truly blind the patients). He would argue that in this case blinding which would require anesthesia is the only way that valid, useful evidence could have been created. Even though we graded the study U (uncertain validity and usefulness) and would not use the results to inform decisions about efficacy or effectiveness because of the threats to validity, the study does report information regarding risks of surgery that may be of great value to patients. References 1 Jüni P, Altman DG and Egger M. Systematic reviews in health care: Assessing the quality of controlled clinical trials. BMJ. 2001;323;42-46. PMID: 11440947 2 Schulz KF, Chalmers I, Hayes RJ, Altman DG. Empirical evidence of bias. Dimensions of methodological quality associated with estimates of of treatment effects in controlled trials. JAMA 1995;273:40812. PMID: 7823387. 3 Weinstein JN, Tosteson TD, Lurie JD, et al. Surgical vs nonoperative treatment for lumbar disk herniation: the Spine Patient Outcomes Research Trial (SPORT): a randomized trial. JAMA. 2006;296:2441-2450. PMID: 17119141 4 Flum DR. Interpreting Surgical Trials With Subjective Outcomes Avoiding UnSPORTsmanlike Conduct. JAMA, November 22/29, 2006—Vol 296, No. 20: 2483-1484. PMID: 17119146
|
||||||||||||||||||||||||||||||||
| The
Importance of Blinded Assessors in RCTs
We have previously summarized the problems associated with lack of blinding in surgical (and other) studies — see Blinding in Surgery Trials in a previous DelfiniClick™. The major problem with unblinded studies is that the outcomes in the intervention group are likely to be falsely inflated because of the biases introduced by lack of blinding. Recently a group of orthopedists identified and reviewed thirty-two randomized, controlled trials published in The Journal of Bone and Joint Surgery between 2003 and 2004 to evaluate the effect of blinded assessment vs non-blinded assessment on reported outcomes [1]. Results
Conclusion Delfini Commentary Reference
|
||||||||||||||||||||||||||||||||
Testing
the Success of Blinding Blinding in clinical trials of medical interventions is important. Researchers have reported that lack of blinding is likely to overestimate benefit by up to a relative 72%. [1-4] Optimal reporting of blinding entails who was blinded, how the blinding was performed and whether the blind was likely to have been successfully maintained. To assess the latter, investigators, at times, attempt to test the success of blinding following a clinical trial by asking clinicians and/or patients to identify which arm they believed they were assigned to. However, the results of this attempt may be misleading due to chance and there is a strong possibility of confounding due to pre-trial hunches about efficacy as described by Sackett in a letter to the BMJ, "Why not test success of blinding?" PMID: 15130997.[5] To illustrate Sackett's point with a brief scenario, let us say that a new agent is approved and interest about the agent is running high. A clinician participating in a new clinical trial of that agent who is already predisposed to believe the drug works is likely to guess all treatment successes were a result of patients being assigned to this arm. If an agent actually is effective, then it will be likely to appear that blinding was not successful even if it was. Sackett describes the reverse scenario here: http://www.bmj.com/cgi/content/full/328/7448/1136-a
|
||||||||||||||||||||||||||||||||
Time-related Biases Including Immortality Bias We were recently asked about the term “immortality bias.” The easiest way to explain immortality bias is to start with an example. Imagine a study of hospitalized COPD patients undertaken to assess the impact of drug A, an inhaled corticosteroid preparation, on survival. In our first example, people are randomized to receive a prescription to drug A post-discharge or not to receive a prescription. If someone in group A dies prior to filling their prescription, they should be analyzed as randomized and, therefore, they should be counted as a death in the drug A group even though they were never actually exposed to drug A. Let's imagine that drug A confers no survival advantage and that mortality for this population is 10 percent. In a study population of 1,000 patients in each group, we would expect 100 deaths in each group. Let us say that 10 people in the drug A group died before they could receive their medication. If we did not analyze the unexposed people who died in group A as randomized, that would be 90 drug A deaths as compared to 100 comparison group deaths—making it falsely appear that drug A resulted in a survival advantage. If drug A actually works, the time that patients are not exposed to the drug works a little against the intervention (oh, yes, and do people actually take their drug?), but as bias tends to favor the intervention, this probably evens up the playing field a bit—there is a reason why we talk about "closeness to truth" and "estimates of effect." "Immortality bias" is a risk in studies when there is a time period (the "immortal" or the "immune" time when the outcome is other than survival) in which patients in one group cannot experience an event. Setting aside the myriad other biases that can plague observational studies, such as the potential for confounding through choice of treatment, to illustrate this, let us compare our randomized controlled trial (RCT) that we just described to a retrospective cohort study to study the same thing. In the observational study, we have to pick a time to start observing patients, and it is no longer randomly decided how patients are grouped for analysis, so we have to make a choice about that too. For our example, let us say we are going to start the clock on recording outcomes (death) beginning at the date of discharge. Patients are then grouped for analysis by whether or not they filled a prescription for drug A within 90 days of discharge. Because "being alive" is a requirement for picking up prescription, but not for the comparison group, the drug A group potentially receives a "survival advantage" if this bias isn't taken into account in some way in the analysis. In other words, by design, no deaths can occur in the drug A group prior to picking up a prescription. However, in the comparison group, death never gets an opportunity to "take a holiday" as it were. If you die before getting a prescription, you are automatically counted in the comparison group. If you live and pick up your prescription, you are automatically counted in the drug A group. So the outcome of "being alive" is a prerequisite to being in the drug A group. Therefore, all deaths of people not filling a prescription that occur prior to that 90 day window get counted in the comparison group. And so yet another example of how groups being different or being treated differently other than what is being studied can bias outcomes. Many readers will recognize the similarity between immortality bias and lead time bias. Lead time bias occurs when earlier detection of a disease, because of screening, makes it appear that the screening has conferred a survival advantage—when, in fact, the "greater length of time survived" is really an artifact resulting from the additional time counted between disease identification and when it would have been found if no screening had taken place. Another instance where a time-dependent bias can occur is in oncology studies when intermediate markers (e.g., tumor recurrence) are assessed at the end of follow-up segments using Kaplan-Meier methodology. Recurrence may have occurred in some subjects at the beginning of the time segment rather than at the end of a time segment. It is always good to ask if, in the course of the study, could the passing of time have had a resulting impact on any outcomes? Other Examples —
All of these time-dependent biases can distort study results.
|
||||||||||||||||||||||||||||||||
Empirical Evidence of Attrition Bias in Clinical Trials The commentary, “Empirical evidence of attrition bias in clinical trials,” by Juni et al [1] is a nice review of what has transpired since 1970 when attrition bias received attention in a critical appraisal of a non-valid trial of extracranial bypass surgery for transient ischemic attack. [2] At about the same time Bradford Hill coined the phrase “intention-to-treat.” He wrote that excluding patient data after “admission to the treated or control group” may affect the validity of clinical trials and that “unless the losses are very few and therefore unimportant, we may inevitably have to keep such patients in the comparison and thus measure the ‘intention-to-treat’ in a given way, rather than the actual treatment.”[3] The next major development was meta-epidemiological research which assessed trials for associations between methodological quality and effect size and found conflicting results in terms of the effect of attrition bias on effect size. However, as the commentary points out, the studies assessing attrition bias were flawed. [4,5,6]. Finally a breakthrough in understanding the distorting effect of loss of subjects following randomization was seen by two authors evaluating attrition bias in oncology trials.[7] The investigators compared the results from their analyses which utilized individual patient data, which invariably followed the intention-to-treat principle with those done by the original investigators, which often excluded some or many patients. The results showed that pooled analyses of trials with patient exclusions reported more beneficial effects of the experimental treatment than analyses based on all or most patients who had been randomized. Tierney and Stewart showed that, in most meta-analyses they reviewed based on only "included" patients, the results favored the research treatment (P = 0.03). The commentary gives deserved credit to Tierney and Stewart for their tremendous contribution to critical appraisal and is a very nice, short read. References 1. Jüni P, Egger M. Commentary: Empirical evidence of attrition bias in clinical trials. Int J Epidemiol. 2005 Feb;34(1):87-8. Epub 2005 Jan 13. Erratum in: Int J Epidemiol. 2006 Dec;35(6):1595. PubMed PMID: 15649954. 2. Fields WS, Maslenikov V, Meyer JS, Hass WK, Remington RD, Macdonald M. Joint study of extracranial arterial occlusion. V. Progress report of prognosis following surgery or nonsurgical treatment for transient cerebral ischemic attacks. PubMed PMID: 5467158. 3. Bradford Hill A. Principles of Medical Statistics, 9th edn. London: The Lancet Limited, 1971. 4. Schulz KF, Chalmers I, Hayes RJ, Altman D. Empirical evidence of bias. Dimensions of methodological quality associated with estimates of treatment effects in controlled trials. JAMA 1995;273:408–12. PMID: 7823387 5. Kjaergard LL, Villumsen J, Gluud C. Reported methodological quality and discrepancies between large and small randomized trials in metaanalyses. Ann Intern Med 2001;135:982–89. PMID 11730399 6. Balk EM, Bonis PA, Moskowitz H, Schmid CH, Ioannidis JP, Wang C, Lau J. Correlation of quality measures with estimates of treatment effect in meta-analyses of randomized controlled trials. JAMA. 2002 Jun 12;287(22):2973-82. PubMed PMID: 12052127. 7. Tierney JF, Stewart LA. Investigating patient exclusion bias in meta-analysis. Int J Epidemiol. 2005 Feb;34(1):79-87. Epub 2004 Nov 23. PubMed PMID: 15561753.
|
||||||||||||||||||||||||||||||||
| Attrition
Bias: Intention-to-Treat Basics Updated 02/11/2013 In general, we approach critical appraisal of RCTs by evaluating the four major components of a trial— study population (including how established), the intervention, the follow-up and the assessment. There is very little controversy about the process of randomizing in order to distribute known and unknown confounders as equally as possible between the groups. There also appears to be general understanding that the only difference between the two groups should be what is being studied. However, what seems to receive much less attention is the considerable potential for bias that occurs when data is missing from subjects because they do not complete a study or are lost to follow-up, and investigators use models to deal with that missing data. The only way to prevent this bias is to have data on all randomized subjects. This is frequently not possible. And bias creeps in. Intent-to-treat designs that provide primary outcome data on all randomized patients are the ideal. All patients randomized are included in the analysis — and patients are analyzed in the same groups to which they were randomized. Unfortunately we are rarely provided with all of this information, and we must struggle to impute the missing data—i.e., we must do our own sensitivity analysis and recalculate p-values based on various assumptions (e.g., worst case scenario, all missing subject fail, etc.) — when possible! All too often, papers do not report sufficient data to perform these calculations, or the variables do not lend themselves to this type of analysis because they cannot be made binomial, and we are left with the authors’ frequently inadequate analysis which might result in our assigning a low grade to the study. We see many studies where the analysis is accomplished using Kaplan-Meier estimates and other models to deal with excluded patient data. As John Lachin has pointed out, this type of “efficacy subset” analysis has the potential for Type I errors (study findings=significant difference between groups; truth=no significant difference) as large as 50 percent or higher [1]. Lachin and others have shown that the statistical methods used when data is censored (meaning not included in analysis either through patient discontinuation or data being removed), frequently assume that —
We want to see data on all patients randomized. When patients are lost to follow-up or do not complete a study, we want to see intent-to-treat analyses with clear statements about how the missing data is imputed. We agree with Lachin’s suggestion that the intent-to-treat design is likely to be more powerful (than statistical modeling), and especially powerful when an effective treatment slows progression of a disease during its administration—i.e., when a patient benefits long after the patient becomes noncompliant or the treatment is terminated. Lachlin concludes that, “The bottom line is that the only incontrovertibly unbiased study is one in which all randomized patients are evaluated and included in the analysis, assuming that other features of the study are also unbiased. This is the essence of the intent-to-treat philosophy. Any analysis which involves post hoc exclusions of information is potentially biased and potentially misleading.” We also agree with an editorial comment made by Colin Begg who states that, “The properly conducted randomized trial, where the primary endpoint and the statistical method are specified in advance, and all randomized patients contribute to the analysis in an intent-to-treat fashion, provides a structure that severely limits our opportunity to obscure the facts in favor of our theories.” Begg concludes by supporting Lachin’s assessment: “He is absolutely correct in his view that the recent heavy emphasis on the development of missing data methodologies in statistical academic circles has led to a culture in which poorly designed studies with lots of missing data are perceived to be increasingly more acceptable, on the flimsy notion that sophisticated statistical modeling can overcome poor quality data. Mundane though it may sound, I strongly support his [Lachin’s] assertion that `…the best way to deal with the problem (of missing data) is to have as little missing data as possible…’ Attention to the development of practical strategies for obtaining outcome data from patients who withdraw from trials, notably short-term trials with longitudinal repeated measures outcomes, is more likely to lead to improvement in the quality of clinical trials than the further development of statistical techniques that impute the missing data. [2]” It would be difficult to express our concern more eloquently than what is stated above. The two examples below amplify this. Example 1: A group of rheumatologists were uncomfortable with Kaplan-Meier statistical methods for analysis of outcomes in rheumatology studies. Their concern was that, even though Kaplan-Meier methods are frequently used to analyze cancer data, very little research has been done to validate the use of Kaplan-Meir methods for drug studies (i.e. endpoints such as stopping medication because of side-effects or lack of efficacy. They tested three assumptions upon which Kaplan-Meier survival analysis depends: 1. Patients recruited
early in the study should have the same drug survival (i.e.
time to determination of lack of efficacy or onset of side-effects)
as those recruited later; To examine the above assumptions, the authors plotted survival curves for the different groups (i.e. subjects recruited early vs those recruited later) and showed that, in each case, the drug survival characteristics were statistically different between the two groups (p<0.01). They conclude, as did Lachin, that it is not possible to prove that survival analysis is always invalid (even though they did show in this case the Kaplan-Meier analysis was invalid). However, this group feels that the onus of proof is on those who advocate for drug survival analysis—i.e., using statistical modeling rather than presenting all the data so that the reader can do an ITT analysis or sensitivity analysis[3]. Example 2: A similar situation occurred when a group of geriatricians became concerned that many different, and sometimes inappropriate, statistical techniques are used to analyze the results of randomized controlled trials of falls prevention programs for elderly people. To evaluate this, they used raw data from two randomized controlled trials of a home exercise program to compare the number of falls in the exercise and control groups using two different survival analysis models (Andersen-Gill and marginal Cox regression) and a negative binomial regression model for each trial. In one trial, the three different statistical techniques gave similar results for the efficacy of the intervention but, in the second trial, underlying assumptions were violated for the two Cox regression models. Negative binomial regression models were easier to use and more reliable. Proportional Hazards and Cox Regression Models: The authors point that although the use of proportional hazards or Cox regression models can test whether several factors (for example, intervention group, baseline prognostic factors) are independently related to the rate of a specific event (e.g., a fall) that using survival probabilities to analyze time to fall events assumes that, at any time, participants who are censored before the end of the trial have the same risk of falling as those who complete the trial. An assumption of proportional hazards models is that the ratio of the risks of the events in the two groups is constant over time and that the ratio is the same for different subgroups of the data, such as age and sex groups. This is known as the proportionality of hazards assumption. No particular distribution is assumed for the event times, that is, the time from the trial start date for the individual to the outcome of interest (in this case, a fall event) such as would be the case for death following cardiac surgery, where one assume a greater frequency of deaths to occur close to the surgical event. Andersen-Gill and marginal Cox proportional hazards regression: These models are used in survival analyses when there are multiple events per person in a trial. The Andersen-Gill extension of the proportional hazards regression model and the marginal proportional hazards regression model are both statistical techniques used for analyzing recurring event data. Negative Binomial Regression: The negative binomial regression model can also be used to compare recurrent event rates in different groups. It allows investigation of the treatment effect and confounding variables, and adjusts for variable follow-up times by using time at risk. In the first study of falls in the elderly, all three statistical approaches indicated that falls were significantly reduced by 40% (Andersen-Gill Cox model), 44% (marginal Cox model) and 39% (negative binomial regression model) in the exercise group compared with those in the control group. The tests for the proportionality of hazards for both types of survival regression models indicated that these models “worked” for the recurring falls problem. In the second study, there was evidence that the proportional hazards assumption was violated in the Andersen-Gill and marginal Cox regression models (proportional hazards test). The authors point out that survival analysis is not valid if participants who are censored do not have the same rate of outcome (risk of falling) as those who continue in the trial. The authors point out and cite a reference for concluding that those not completing a falls prevention trial are at higher risk of falling and, if fewer from one group than another group withdraw, it may point to a study-related cause for the change in discontinuation, and results may be biased. Summary Many researchers, biostatisticians and others struggle with this area—there appears to be no clear agreement in the clinical research community about how to best address these issues. There also is inconsistent evidence on the effects of attrition on study results. We, therefore, believe that studies should be evaluated on a case-by-case basis. The key question is, "Given that attrition has occurred, are the study results likely to be true?" It is important to look at the contextual elements of the study and reasons for discontinuation and loss-to-follow up and to look at what data is missing and why to assess likely impact on results. Attrition may or may not impact study outcomes depending, in part, upon the reasons for withdrawals, censoring rules and the resulting effects of applying those rules, for example. However, differential attrition issues should be looked at especially closely. Unintended differences between groups are more likely to happen when patients have not been allocated to their groups in a blinded fashion, groups are not balanced at the onset of the study and/or the study is not effectively blinded or an effect of the treatment has caused the attrition. References 1. Lachin JM. Statistical considerations in the intent-to-treat principle. Control Clin Trials 2000;21:167–189. PMID: 11018568 2. Utley M. et al. Potential bias in Kaplan-Meier survival analysis applied to rheumatology drug studies. Rheumatology 2000;39:1-6. 3. Robertson, MC et al. Statistical Analysis of Efficacy in Falls Prevention. Journal of Gerontology 2005;60:530–534.
|
||||||||||||||||||||||||||||||||
Loss to Follow-up Update Heads up about an important systematic review of the effects of attrition on outcomes of randomized controlled trials (RCTs) that was recently published in the BMJ.[1] Background
BMJ Study Methods
Key Findings
Summary Reference Article is freely available at— Supplementary information is available at— For sensitivity analysis results tables, see Appendix 2 at—
|
||||||||||||||||||||||||||||||||
| Intention-to-Treat
Analysis & the Effects of Various Methods of Handling Missing
Subjects: The Case of the Compelling Rationale 08/04/08 The goals of Intention-to-Treat Analysis (ITT) are to preserve the benefits of randomization and mitigate bias from missing data. Not doing so is equivalent to changing a study design from a randomized controlled trial (RCT), which is an experiment, into a study with many features of a cohort design, and thus resulting in many of problems inherent in observational studies. For example, removal or attrition of patients after randomization (eg, through disqualification, a decision to not include in the analysis, discontinuations, missingness, etc.) may systematically introduce bias, or bias may be introduced through various aspects related to the interventions used. In ITT analysis, all patients are included in the analysis through an assignment of a value for those missing final data points. For background on this, get basic information above and in our EBM tips, plus the table of contents on this page for further reading. The purpose of this Click is to provide some resistance to the concept of a “compelling rationale” for excluding patients from analysis. Sometimes researchers come up with seemingly compelling rationale for removing patients from analysis; but, as several EBM experts suggest, “sample size slippages” put the study on a slippery slope. Examples
Key Points
References 2. Schulz KF, Grimes
DA. Sample size slippages in randomised trials: exclusions and
the lost and wayward. The Lancet. Vol 359. March 2, 2002: 781-785.
PMID: 11888606 3. Gerard E. Dallal, PhD: http://www.jerrydallal.com/LHSP/itt.htm accessed on 08/01/2008
|
||||||||||||||||||||||||||||||||
Intention-to-Treat & Imputing Missing Variables: Last-Observation-Carried-Forward (LOCF)—When We Might Draw Reasonable Conclusions Principles of Intention-to-Treat (ITT) analysis require analyzing all patients in the groups to which they were assigned. This is regardless of whether they received their assigned intervention or not and is regardless of whether they completed the trial or not. For those who do not complete the study or for whom data on endpoints is missing, a value is to be assigned—which is referred to as “data imputation.” As anything that systematically leads away from truth is a bias, imputing data is, necessarily a bias. However, it is generally considered the preferred analysis method because it is thought to help preserve the benefits of randomization and deal with problems of missing data. Imputing outcomes for missing data points is either done to try and approximate what might have been true or is used as a method to test the strength of the results—meaning if I put the intervention through a tough challenge, such as assigning failure to those missing in the intervention group and success to those missing in the comparison group, is any difference favoring the intervention still statistically significant? This DelfiniClick™ is focused on "last-observation-carried-forward" (LOCF) which is frequently used to assign missing variables. LOCF simply means, for example, that if I lost a patient at month 6 in a 12-month trial, I assign the 12-month value for my data point from what I observed in month 6. A number of authors consider this a method prone to bias for various reasons [1-6] not the least of which is that it is not robust and may not be a reasonable predictor of outcomes. However, as many researchers use LOCF for data imputation, it is worth exploring whether there are circumstances that allow us to draw reasonable conclusions from otherwise valid studies when LOCF is employed. Although using LOCF in progressive conditions clearly distorts results, we might be able to get at some reasonable answers despite its use because we know the direction or trend line without effective treatment. Scenario 1: Ideal Study Circumstances & Drug Does Not Work Assumptions
Imagine a graph that plots results between the groups over various time points—see below. We would expect the lines to be roughly the same. The resulting bias would be that the rate and lower boundary of the reported outcome would be higher than what would actually be true. However, in considering the difference in outcomes between groups, we would have a truthful answer: no difference between the groups.
Scenario 2: Ideal Study Circumstances & Drug Does Work Assumptions
Imagine a graph that plots results between the groups over various time points—see below. We would expect the lines to diverge. The resulting bias would be that the rate and lower boundary of the reported outcome would be higher than what would actually be true in the placebo group. Conversely, the rate and the upper boundary of the reported outcome would be lower than what would actually be true in the active agent group. So the bias would favor placebo and be conservative against the intervention. However, in considering the difference in outcomes between groups, we would have a truthful answer: a difference between the groups.
Scenario 3: Uncertain Study Circumstances & Unknown if Drug Works Assumptions
If the lines do diverge it seems reasonable to conclude one of three things: 1) we have a chance effect, 2) a systematic bias explains the reported improvement in the active agent group; or, 3) the agent actually works.
Chance is a possibility, though not so likely with a prespecified outcome. If the reporting were actually graphed out over time rather than just reported as a summary measure, and we saw consistency in the data points, we would conclude it would be unlikely to be a chance effect. Another possibility could be differences in care or co-interventions. Effective concealment of allocation and effective blinding would be likely to enable us to rule out such differences being due to bias from knowing the group to which a person was assigned. Therefore, any such resulting differences would be reasonably likely to be a result of some action of the agent. Actions of the agent would generally be either benefit or harm. If the agent caused a harm that resulted in a greater number of people in the active agent group receiving a co-intervention, that intervention would have to be effective or synergistic with the active agent, in order to see a reported benefit—which is probably not very likely. (And it is possible that this kind of situation would result in failure of successful blinding—in that instance, we would look for anything that may have resulted in improvement to patients other than the agent.) If the agent is truly working, it is unlikely that subjects would be receiving a co-intervention. That scenario would be more likely to result if the patient were on placebo or the drug did not work. In the latter instance, probably an equal number of subjects in both groups would be getting a co-intervention and the likelihood would be no or little difference between the groups. Conclusion Using LOCF in Progressive Illness We strongly prefer that LOCF not be utilized for data imputation for reasons studied by various authors [1-6], but, in the case of a progressive illness, for example, with unlikely spontaneous improvement, it may be reasonable to trust claims of efficacy under the right study conditions, with a recognition that the estimates of effect will likely be distorted. Using LOCF in progressive illnesses has the disadvantage of likely upgrading of an estimate of effect where there is actually no effect and downgrading estimates for true effectiveness. However, our ability to discern potentially efficacious treatment is aided by expected trending. For example in a study with a placebo group with progressive disease and an intervention group with improving disease, LOCF would be conservative because it would imput better-than-actual observations in the placebo group and worse-than-actual observations in the intervention group. Reporting by various time points strengthens confidence that outcomes are not due to chance. Conclusion Using LOCF in Non-progressive Illness Using LOCF in non-progressive illness is possibly more problematic as we do not have the assistance of an expected trend for either group. Consequently, we have fewer clues to aid us in drawing any conclusion. References [Delfini LOCF Summary Notes]
|
||||||||||||||||||||||||||||||||
| Intention-to-Treat
Analysis & Censoring: Rofecoxib Example
In a recent DelfiniClick, we voiced concern about models used for analysis of study outcomes, especially when information about assumptions used is not reported. In the July 13, 2006 issue of the NEJM (published early on-line), there is a very informative example of what can happen when authors claim to analyze data using the intention-to-treat (ITT) principle, but do not actually do an ITT analysis. Case Study
The reason for the correction appears to be an analysis of data released by Merck to the FDA on May 11, 2006. These data provide information about events in the subgroup of participants whose data were censored if they had an event more than 14 days after early discontinuation of the study medication. Twelve thrombotic events that occurred more than 14 days after the study drug was stopped but within 36 months after randomization were noted. Eight of the “new” events were in the rofecoxib group, and these events had a definite effect on the published survival curve for rofecoxib (Fig. 2 of the original article). When including the new data, the separation of the rofecoxib and placebo curves begins earlier than 18 months. The point of all this is that it is difficult to determine the validity of a study when assumptions used in censoring of data are not reported. With insufficient information about loss to follow-up, we cannot do our own sensitivity analyses for imputing missing data with our goal being to “test” the P-value reported by the authors. To reiterate from our previous DelfiniClick:
1. Correction to: Cardiovascular events associated with rofecoxib in a colorectal adenoma chemoprevention trial. N Engl J Med 2006;355:221. 2. Bresalier RS, Sandler RS, Quan H, et al. Cardiovascular events associated with rofecoxib in a colorectal adenoma chemoprevention trial. N Engl J Med 2005;352:1092-102.
|
||||||||||||||||||||||||||||||||
Intention-to-Treat Analysis: Misreporting and Migraine Intention-to-treat analysis (ITT) is an important consideration in randomized, controlled trials. And determining whether an analysis meets the definition of ITT analysis or not is incredibly easy. Yet many authors mislabel their analyses as ITT when they are not and report their results in a biased way. An article in BMJ dealing with migraine illustrates some important points about ITT analysis and reminds us that authors continue to report outcomes in ways that are highly likely to be biased. Case Study As described in the CONSORT STATEMENT (http://www.consort-statement.org/), among other things, ITT analysis “prevents bias caused by the loss of participants, which may disrupt the baseline equivalence established by random assignment and which may reflect non-adherence to the protocol.” ITT analysis is
defined as follows in the CONSORT STATEMENT: An easy way to tell if an ITT analysis has been done is to look at the number randomized in each group and see if that number is the same number that is analyzed. Number in should be the same number out — in each group as originally randomized. And, as you can see, determining whether an analysis meets the definition of ITT analysis or not is incredibly easy. Yet many authors mislabel their analyses as ITT when they are not. In one study, in articles reviewed authors were found to say they had performed an ITT analysis when 47% of the time they had not. (Kruse, R. B Alper et al. Intention-to-treat analysis: Who is in? Who is out? JFamPrac 2002 Nov: (Vol 51) #11) An article in BMJ dealing with migraine illustrates some important points about ITT analysis and reminds us that authors continue to report outcomes in ways that are highly likely to be biased. In the Schrader study, 30 patients with migraine were randomized to receive lisinopril and 30 were randomized to placebo. The authors, however, only reported on 55 patients in their so-labeled “intention-to-treat analysis” because of poor compliance. This is not an intention-to-treat analysis. The following is reported by the authors:
The authors have done as their primary analysis an “optimal compliance analysis.” They also state they have done an ITT analysis but they have not. It is fine to do non-ITT analyses – “as treated,” and “completer” analysis are two common ones you will frequently see. But the ITT analysis must be the primary analysis. Others are considered secondary (and should be labeled and treated as such). And so how does one handle loss to follow-up? There are various methods, but there is an important principle which should guide us — the method should put the burden of proof on the intervention. This is the opposite of our court system – “guilty until proven innocent,” in effect. So what you do is assign an outcome to those lost to follow-up that puts the intervention through the toughest test. “Worse-case-basis” is one method; “last-observed result” is another. If you put the intervention through the hardest test, and you still have positive results (assuming the study is otherwise valid), you can feel much more confident about the reported outcomes truly being valid. If the missing subjects in the above-mentioned migraine article are handled this way, there is no statistically significant difference between lisinopril and placebo. We are frequently asked what is an acceptable percent loss to follow-up. It depends on whether the loss to follow-up will affect the results or not. We have seen what we consider to be important changes even with small numbers lost to follow-up. We recommend that you do sensitivity analyses (“what if”s) to see what the effect might be if you had the data. Without doing an ITT analysis, we are very uncomfortable about the results if five percent or more of subjects have missing data for analyzing endpoints -- and even less than five percent might have impact. For those who would like more information, the following article is an excellent one on the subject and is very helpful for understanding issues pertaining to ITT analysis and randomization as well: Schulz
KF, Grimes DA See other reading on ITT analysis is available here. Very special thanks to Murat Akalin, MD, MPH, UCSD, for selecting a great article for case study, participating in this review, doing the ITT analysis and encouraging us to write this.
|
||||||||||||||||||||||||||||||||
Missing
Data Points: Difference or No Difference — Does it Matter? We continue to study the "evidence on the evidence" — meaning we are continually on the look out for information which may shed light on the impact on reported outcomes of certain kinds of bias, for example, or information that provides help in how to handle different biases. Missing data points is an issue affecting the majority of studies, but currently there is not clarity on how big an issue this is, especially when there is not a differential loss between groups. We have spoken about this issue with John M. Lachin, Sc.D., Professor of Biostatistics and Epidemiology, and of Statistics, The George Washington University, and author. (And then we did some "hard thinking" as David Eddy would say.) Even without differential loss between the groups overall, a differential loss could occur in prognostic variables — and readers are rarely going to have access to data about changes in prognostic characteristics post-baseline reporting. A Letter on This Topic: Attrition
Bias Caution: Non-differential Loss Between Groups Can Threaten
Validity Read our BMJ Rapid Response Letter to a critical appraisal and quiz that we thought missed an important point about non-differential drop outs, our rationale and our recommedations for future reporting.
|
||||||||||||||||||||||||||||||||
Attrition Bias and Baseline Characteristic Testing (Esp for Non-Dichotomous Variables) Not having complete information on all study subjects is a common problem in research. The key issue is whether those subjects for whom data is missing are similar or not to those for whom data is available. In other words, the question is might reported outcomes be distorted due to an imbalance in the groups for which we have information? As Schulz and Grimes state, “Any erosion…over the course of the trial from those initially unbiased groups produces bias, unless, of course, that erosion is random…”. [1] As of this date, we are not aware of a preferred way to handle this problematic area and the effect of various levels of attrition remains unclear.[2], [3]. We have previously summarized our position on performing sensitivity analyses when variables are dichotomous. Non-dichotomous data pose unique challenges. We think it is reasonable to perform a sensitivity analysis on subjects for whom data is available and for whom it is not. Others have recommended this approach. Dumville et al states, “Attrition can introduce bias if the characteristics of people lost to follow-up differ between the randomised groups. In terms of bias, this loss is important only if the differing characteristic is correlated with the trial’s outcome measures.…we suggest it is informative to present baseline characteristics for the participants for whom data have been analysed and those who are lost to follow-up separately. This would provide a clearer picture of the subsample not included in an analysis and may help indicate potential attrition bias.” Other suggestions regarding missing data through censoring have been provided to us by John M. Lachin, Sc.D., Professor of Biostatistics and Epidemiology, and of Statistics, The George Washington University (personal communication):
There are some caveats that should be raised regarding this kind of sensitivity analysis. There may be other resulting imbalances between groups that are not measurable. Also no differences in characteristcs of the groups could be due to insufficient power to reveal true differences. And importantly, differences found could be due to chance. However, if the groups appear to be similar, we think it may reasonable to conclude that such sensitivity analyses may be suggestive that the groups remained balanced despite the number of discontinuations. If the groups remained balanced, then—depending on details of the study— the discontinuations may not have created any meaningful distortion of results. However, even if they are not balanced, it may be that the results are dependable. Read our update on attrition bias. References 1. Schulz KF, Grimes DA. Sample size slippages in randomised trials: exclusions and the lost and wayward. Lancet. 2002 Mar 2;359(9308):781-5. PubMed PMID: 11888606. 2. Dumville JC, Torgerson DJ, Hewitt CE. Reporting attrition in randomized controlled trials. BMJ. 2006 Apr 22;332(7547):969-71. Review. PubMed PMID: 16627519; PubMed Central PMCID: PMC1444839. 3. Hewitt CE, Kumaravel B, Dumville JC, Torgerson DJ; Trial attrition study group. Assessing the impact of attrition in randomized controlled trials. J Clin Epidemiol. 2010 Nov;63(11):1264-70. Epub 2010 Jun 22. PubMed PMID: 20573482.
|
||||||||||||||||||||||||||||||||
Attrition Bias & A Biostatistician Weighs In: Dr. Steve Simon on "Why is a 20% dropout rate bad?" We have written numerous times about attrition bias. Large numbers of patients dropping out of studies or unable to complete participation in studies tends to be one of the biggest barriers in passing critical appraisal screenings. This area is also one of the least understood in evaluating impact on outcomes, with a paucity of helpful evidence. Biostatistician, Steve Simon, addresses dropout rates in this month’s newsletter in his helpful entry titled, “Why is a 20% dropout rate bad?” Steve provides us with some math to tell us that, “If both the proportion of dropouts is small and the difference in prognosis between dropouts and completers is small, you are truly worry free.” He also gives us help with differential loss: “The tricky case is when only one [proportion of dropouts] is small. You should be okay as long as the other one isn't horribly bad. So a small dropout rate is okay even with unequal prognosis between completers and dropouts as long as the inequality is not too extreme. Similarly, if the difference in prognosis is small, then any dropout rate that is not terribly bad (less than 30% is what I'd say), should leave you in good shape.” He gives us a rule of thumb to go by: “Now it is possible to construct settings where a 10% dropout rate leads to disaster or where you'd be safe even with a 90% dropout rate, but these scenarios are unrealistic. My rule is don't worry about a dropout rate less than 10% except in extraordinary settings. A dropout rate of 30% or higher though, is troublesome unless you have pretty good inside information that the difference in prognosis between dropouts and completers is trivially small.” Here's our current thinking on attrition bias. You can read Steve’s full entry here and even sign-up to be on his mailing list:
|
||||||||||||||||||||||||||||||||
| Quality
of Studies: VIGOR
Why is it that Vioxx made the front page of the NYTs in December of 2005 when it was withdrawn from the market in 2004? Reason: it was discovered that the authors “removed” 3 patients with CV events from the data in the days preceding final hardcopy submission of the VIGOR study to the NEJM. Here are some key points made by the NEJM in an editorial entitled, Expression of Concern: Bombardier et al., “Comparison of Upper Gastrointestinal Toxicity of Rofecoxib and Naproxen in Patients with Rheumatoid Arthritis,” N Engl J Med 2000;343:1520-8, published on the web 12/8/04 and in hard copy, N Engl J Med. 2005.353:25:
Merck's position is that the additional heart attacks became known after the publication's "cutoff" date for data to be analyzed and were therefore not reported in the Journal article. To our knowledge, NEJM has not responded to Merck's point. In any event, without the 3 missing subjects the relative risk of myocardial infarction risk was 4.25 for refecoxib versus naproxen, 95% CI (1.39 to 17.37). This is based on 17 MIs out of 2315 person years of exposure for rofecoxib and 4 MIs out of 2336 person years for naproxen. Adding in the 3 missing subjects (new total of 20 MIs in the rofecoxib group) increases the relative risk to 5.00, 95% CI (1.68 to 20.13). This demonstrates how losing just a few subjects even in a large study can change results dramatically. For readers, the important point is to look carefully to be sure that all randomized patients were accounted for. |
||||||||||||||||||||||||||||||||
| Avoiding
Overestimates of Benefit: Composite Endpoints in Cardiovascular
Trials 04/20/09 Composite endpoints represent the grouping together of individual endpoints to serve as a single outcome measure. They are frequently used in clinical trials to reduce requirements for sample size. In other words, composite endpoints — by adding together individual outcomes — increase the overall event rates and, thus, the statistical power of a study to demonstrate a statistical and clinically meaningful difference between groups if one exists. Composite endpoints also enable researchers to conduct studies of smaller size and still reach what may be clinically meaningful outcomes. It has been pointed out, however, that the trade-offs for this increased power may include difficulties for readers in correctly interpreting results. Several investigators [1,2] have pointed out that composite endpoints may be misleading if the investigators —
For example, in cardiovascular trials the composite endpoint of cardiovascular mortality, myocardial infarction and revascularization procedures is frequently encountered. The reader is very likely to conclude that the effect for meaningful outcomes is much greater than the reported results based on the composite endpoint. If one misunderstands that the apparent effect is driven largely by revascularization — which is frequently driven by subjective symptoms and subjective decision-making to perform the procedure — rather than objective outcomes such as myocardial infarction and death, then the reported composite endpoint is likely to result in erroneous (falsely inflated) conclusions by the reader. Lim and colleagues [3] found in a review of 304 cardiovascular trials published in 14 leading journals between January 2000 and January 2007 that 73% trials reported composite primary outcomes. The total number of individual events and the total number of events represented by the composite outcome differed in 79% of trials. P values for composite outcomes less than 0.05 were more frequently reported than P values of 0.05 or greater. Additionally, death as an individual endpoint made a relatively small contribution to estimates of effect summarized by the trials’ composite endpoints, whereas revascularization made a greater contribution. Lim et al. recommend that authors report results for each individual endpoint in addition to the composite endpoint so that readers can ascertain the contribution of each individual endpoint. Readers should bear in mind that safety outcomes when reported as single events can be made to appear “insignificant” since P values are frequently greater that 0.05. If investigators report efficacy results as composite outcomes it may be reasonable to expect safety results to also be reported as composites. Bottom Lines for
Recent Cardiovascular Studies (That Also Apply to Trials in
Other Areas): References 1. Freemantle N,
Calvert M, Wood J, Eastaugh J, Griffin C. Composite outcomes
in randomized trials: greater precision but with greater uncertainty?
JAMA. 2003;289:2554-9. [PMID: 12759327]. |
||||||||||||||||||||||||||||||||
Confidence-Intervals,
Power & Meaningful Clinical Benefit: *[Important Note: Historically, if P<0.05, it has been the convention to say that the results were “ statistically significant”, i.e., statistical testing strongly argues against the null hypothesis (null hypothesis means that there truly is no difference between study samples). If P>0.05, the convention has been to say the results were “non-significant.” It is now preferred to state the exact P-value and avoid categorizing results as statistically significant or non-significant. However, use of the older conventions persists and some of the explanations below make use of the older terms since readers are certain to encounter results reported as “significant” and “non-significant.”] Problems
with Non-Statistically Significant Findings Power calculations are performed prior to a study help investigators determine the number of people they should enroll in the study to try and detect a statistically significant difference if there is one. A power of >= 80% is conventional and provides some leeway for chance. Power calculations are generally performed only for the primary outcome. They entail a lot of assumptions. Good News
About Power! Here’s what they are, and here’s how it’s done: About Confidence
Intervals (CIs) This is how confidence intervals are reported:
How to Use Confidence Intervals to Determine Statistical Significance
How to
Use Confidence Intervals to Determine Conclusiveness of Non-significant
Findings You can look to the CIs to help you with this situation. But first you want to decide what you would consider to be your minimum requirement for a clinically significant outcome (difference between outcomes in the intervention and comparison groups). This is a judgment call. Let’s assume we are looking at a study, the primary outcome for which is absolute reduction in mortality. One might reasonably conclude that an outcome of 1 percent or more is, indeed, a clinically meaningful benefit. [Below is a text explanation. Pictures tell this best, however. Click here to view a PDF of what this looks like graphically. Note that the PDF starts out first with how to determine clinical significance of statistically significant outcomes and then demonstrates how to determine conclusiveness of non-significant findings.] Example:
Clinical Significance Goal For Non-Significant Findings:
How to
Use Confidence Intervals to Determine Conclusiveness of Non-significant
Findings Requirements
for Meaningful Clinical Benefit As with evaluating the conclusiveness of a non-significant finding, you apply judgment to set your minimum requirement for meaningful clinical significance. Using the same example of your choosing 1 percent absolute reduction in mortality as meaningful clinical benefit: Example:
Clinical Significance Goal For Statistically Significant Findings:
Again, pictures probably tell this best. Click here to view the PDF. The Authors
Did Not Report CIs? Evaluate
Definitions for Outcomes
|
||||||||||||||||||||||||||||||||
Why Statements About Confidence Intervals Often Result in Confusion Rather Than Confidence A recent paper by McCormack reminds us that authors may mislead readers by making unwarranted "all-or-none" statements and that readers should be mindful of this and carefully examine confidence intervals. When examining results of a valid study, confidence intervals (CIs) provide much more information than p-values. The results are statistically significant if a confidence interval does not touch the line of no difference (zero in the case of measures of outcomes expressed as percentages such as absolute risk reduction and relative risk reduction and 1 in the case of ratios such as relative risk and odds ratios). However, in addition to providing information about statistical significance, confidence intervals also provide a plausible range for possibly true results within a margin of chance (5 percent in the case of a 95% CI). While the actual calculated outcome (i.e., the point estimate) is “the most likely to be true” result within the confidence interval, having this range enables readers to judge, in their opinion, if statistically significant results are clinically meaningful. However, as McCormack points out, authors frequently do not provide useful interpretation of the confidence intervals, and authors at times report different conclusions from similar data. McCormack presents several cases that illustrate this problem, and this paper is worth reading. As an illustration, assume two hypothetical studies report very similar results. In the first study of drug A versus drug B, the relative risk for mortality was 0.9, 95% CI (0.80 to 1.05). The authors might state that there was no difference in mortality between the two drugs because the difference is not statistically significant. However, the upper confidence interval is close to the line of no difference and so the confidence interval tells us that it is possible that a difference would have been found if more people were studied, so that statement is misleading. A better statement for the first study would include the confidence intervals and a neutral interpretation of what the results for mortality might mean. Example— “The relative risk for overall mortality with drug A compared to placebo was 0.9, 95% CI (0.80 to 1.05). The confidence intervals tell us that Drug A may reduce mortality by up to a relative 20% (i.e., the relative risk reduction), but may increase mortality, compared to Drug B, by approximately 5%.” In a second study with similar populations and interventions, the relative risk for mortality might be 0.93, 95% CI (0.83 to 0.99). In this case, some authors might state, “Drug A reduces mortality.” A better statement for this second hypothetical study would ensure that the reader knows that the upper confidence interval is close to the line of no difference and, therefore, is close to non-significance. Example— “Although the mortality difference is statistically significant, the confidence interval indicates that the relative risk reduction may be as great as 17% but may be as small as 1%.” The Bottom Line
If authors do not provide you with confidence intervals, you may be able to compute them yourself, if they have supplied you with sufficient data, using an online confidence interval calculator. For our favorites, search "confidence intervals" at our web links page: http://www.delfini.org/delfiniWebSources.htm Reference McCormack J, Vandermeer B, Allan GM. How confidence intervals become confusion intervals. BMC Med Res Methodol. 2013 Oct 31;13(1):134. [Epub ahead of print] PubMed PMID: 24172248.
|
||||||||||||||||||||||||||||||||
Confidence Intervals: Overlapping Confidence Intervals—A Clarification Confidence intervals are useful in studies that compare the difference in outcomes between two interventions, because they provide a range of values (representing the estimate of effect) within which the true difference between the two interventions is likely to be found—assuming that the study is valid. However, a common error is to draw conclusions based on overlapping 95% confidence intervals when the results in the two groups are compared. The error is to conclude that the means of two different groups are not statistically significantly different from each other. The error frequently occurs when the investigators in such cases do not calculate the confidence intervals for the difference between the groups. For example, two groups of patients with diabetes received two different drug regimens and hemoglobin A1c measurements were assessed. Results are presented in the table below. Table 1. Example of Overlapping 95% CIs With Statistical Differences
a: For a detailed mathematical explanation about the problems of variability that occur when comparing two means and details about calculating the P-value see Austin et al. [2] As pointed out by Altman, “In comparative studies, confidence intervals should be reported for the differences between groups, not for the results of each group separately.”[1] In theory, two treatment groups can have a statistically significant difference in mean effects at the 5% level of significance, with an overlap of as much as 29% between the corresponding 95% CIs. [2,3,4] Calculations illustrating 6 cases of statistically significant differences in groups with overlapping 95% CIs are shown in Table 2. Table 2. Percent of Overlapping of 95% CIs and P-Values For Differences Between Groups [2]
References
|
||||||||||||||||||||||||||||||||
Primary and Secondary Outcomes: Significance Issues I am a fan of statistician, Steve Simon. You can sign up for his newsletter here: http://www.pmean.com/. I recently wrote him to ask his opinion about significant secondary outcomes when the primary is not statistically significant. Here's the essence of my letter to him and his response follows. At the end of the day, I think it ends up being like many critical appraisal conundrums, "It depends." From Sheri Strite to Steve Simon: Excerpts Assume that my examples represent studies done otherwise “perfectly” to be at low risk of bias with biological plausibility. Let us say for reasons having to do with science fiction (and trying to keep my question completely statistical and logical) that these will be the only studies ever done on their topic using these classes of agents, and I need an option for patient care. So the answer for me can’t be, “Wait for confirmatory studies.” I have heard off and on that, if a primary outcome is not statistically significant*, you should just discount any statistically significant secondary outcomes. I have never been able to find or to conceptualize why this should be so. I found the following written by you. *[Important Note: Historically, if P<0.05 it has been the convention to say that the results were “ statistically significant”, i.e., statistical testing strongly argues against the null hypothesis (null hypothesis means that there truly is no difference between study samples). If P>0.05 the convention has been to say the results were “non-significant.” It is now preferred to state the exact P-value and avoid categorizing results as statistically significant or non-significant. However, use of the older conventions persists and some of the explanations below make use of the older terms since readers are certain to encounter results reported as “significant” and “non-significant.”] “Designating primary outcome variables “When you designate a small number of primary variables, you are making an implicit decision. The success or failure of your intervention will be judged almost entirely by the primary variables. If you find that none of the primary variables are statistically significant, then you will conclude that the intervention was not successful. You would still discuss any significant findings among your secondary outcome variables, but these findings would be considered tentative and would require replication.” But I am not getting the why. And is this necessarily so? Read on. I’d be grateful if I could give you a couple of short scenarios. Please keep in mind that my goals are as a reviewer of evidence (generally on efficacy or safety of therapies) and not as a researcher, so a helpful answer to me would be more in the nature of what I can use, if clinically meaningful, and not how I might redesign my study to make more sense. I am working with what’s out there and not creating new knowledge. Background Scenario Let us assume that Drug X really works. Let us say that we have non-significant findings for overall mortality, which I realize could be a simple case of lack of power. Let’s say that stroke and MI were statistically significant, favoring Drug X over placebo. Is it really true that you believe I should consider these findings tentative? I find it hard to think why that should be. They are related and the lack of significant mortality outcome could again be a power issue. If I am correct that I can consider these clinically useful findings provided the effect size meets my minimum, then what about a scenario in which a researcher chose a really unlikely primary outcome (even a goofy one), but reasonable secondary outcomes? Setting aside the fact that such a choice would give me pause about the rigor of the study—setting this aside just to focus on statistical logic—what if in an otherwise valid study— Drug Y versus Placebo It seems to me that secondary outcomes should be able to be used with as much confidence as primary outcomes given certain factors such as attention to chance effects, relatedness of several outcomes, etc. If I am wrong about this can you enlighten me or steer me to some helpful resources. Most gratefully yours, Sheri And here is Steve's response: http://www.pmean.com/news/201105.html#2
|
||||||||||||||||||||||||||||||||
Progression Free Survival (PFS) in Oncology Trials Progression Free Survival (PFS) continues to be a frequently used endpoint in oncology trials. It is the time from randomization to the first of either objectively measured tumor progression or death from any cause. It is a surrogate outcome because it does not directly assess mortality, morbidity, quality of life, symptom relief or functioning. Even if a valid trial reports a statistically significant improvement in PFS and the reported effect size is large, PFS only provides information about biologic activity of the cancer and tumor burden or tumor response. Even though correlational analysis has shown associations between PFS and overall survival (OS) in some cancers, we believe that extreme caution should be exercised when drawing conclusions about efficacy of a new drug. In other words, PFS evidence alone is insufficient to establish a clinically meaningful benefit for patients or even a reasonable likelihood of net benefit. Many tumors do present a significant clinical burden for patients; however, clinicians frequently mistakenly believe that simply having a reduction in tumor burden equates with clinical benefit and that delaying the growth of a cancer is a clear benefit to patients. PFS has a number of limitations which increases the risk of biased results and is difficult for readers to interpret. Unlike OS, PFS does not "identify" the time of progression since assessment occurs at scheduled visits and is likely to overestimate time to progression. Also, it is common to stop or add anti-cancer therapies in PFS studies (also a common problem in trials of OS) prior to documentation of tumor progression which may confound outcomes. Further, measurement errors may occur because of complex issues in tumor assessment. Adequate blinding is required to reduce the risk of performance and assessment bias. Other methodological issues include complex calculations to adjust for missed assessments and the need for complete data on adverse events. Attrition and assessment bias are made even more difficult to assess in oncology trials using time-to-event methodologies. The intention-to-treat principle requires that all randomly assigned patients be observed until they experience the end point or the study ends. Optimal follow-up in PFS trials is to follow each subject to both progression and death. Delfini Comment FDA approval based on PFS may result in acceptance of new therapies with greater harms than benefits. The limitations listed above, along with a concern that investigators may be less willing to conduct trials with OS as an endpoint once a drug has been approved, suggest that we should use great caution when considering evidence from studies using PFS as the primary endpoint. We believe that PFS should be thought of as any other surrogate marker—i.e., it represents extremely weak evidence (even in studies judged to be at low risk of bias) unless it is supported by acceptable evidence of improvements in quality of life and overall survival. When assessing the quality of a trial using PFS, we suggest the following:
References Carroll KJ. Analysis of progression-free survival in oncology trials: some common statistical issues. Pharm Stat. 2007 Apr-Jun;6(2):99-113. Review. PubMed PMID: 17243095. D'Agostino RB Sr. Changing end points in breast-cancer drug approval—the Avastin story. N Engl J Med. 2011 Jul 14;365(2):e2. doi: 10.1056/NEJMp1106984. Epub 2011 Jun 27. PubMed PMID: 21707384. Fleming TR, Rothmann MD, Lu HL. Issues in using progression-free survival when evaluating oncology products. J Clin Oncol. 2009 Jun 10;27(17):2874-80. doi: 10.1200/JCO.2008.20.4107. Epub 2009 May 4. PubMed PMID: 19414672 Lachin JM. (John M. Lachin, Sc.D., Professor of Biostatistics and Epidemiology, and of Statistics, The George Washington University personal communication) Lachin JM. Statistical considerations in the intent-to-treat principle. Control Clin Trials. 2000 Jun;21(3):167-89. Erratum in: Control Clin Trials 2000 Oct;21(5):526. PubMed PMID: 10822117.
|
||||||||||||||||||||||||||||||||
Adjusting for Multiple Comparisons
Delfini Comment: Reading his paper is a bit difficult, but he make some good points about our not really understanding what chance is all about and that evaluating study outcomes for validity requires critical appraisal for the assessment of bias and other factors as well as the use of statistics for evaluating chance effects. Reference
|
||||||||||||||||||||||||||||||||
| Getting
“Had” by P-values: Confidence Intervals vs P-values
in Evaluating Safety Results: Low-molecular-weight Heparin (LMWH)
Example
In one of our DelfiniClicks we have pointed out that confidence intervals (CIs) can be very useful when examining results of randomized controlled trials (Confidence-Intervals, Power & Meaningful Clinical Benefit). The first step in examining safety results is to decide what you consider to be a range for clinically significant outcomes (i.e., the difference between outcomes in the intervention and comparison group). This is a judgment call. Then examine the 95% CI to see if a clinically significant difference is included in the confidence interval. If it is, the study has not excluded the possibility of a clinically significant harm even if the authors state there is no difference (usually stated as “no difference” based on a non-significant p-value.) It is important to remember that a non-significant p-value can be very misleading in this situation. This can be illustrated by an interesting conversation we recently had with an orthopedic surgeon who felt he couldn’t trust the medical literature to guide him because it gave him “misleading information.” He based his conclusion on a study he read (he wasn’t sure which study it was) regarding bleeding in orthopedic surgery. After talking with him, we searched for studies that may have led to his conclusion and found the following study which illustrates why CIs are preferable to p-values in evaluating safety results and possibly why he was misled.
Let’s evaluate this study’s bleeding rates using confidence intervals. One might reasonably conclude that an outcome of 1 percent or more difference between the groups is, indeed, a clinically meaningful difference in bleeding:
The Cochrane Handbook summarizes this problem nicely:
Comments: Click here for our primer on confidence intervals. When investigators
provide p-values but not confidence intervals, readers can quickly
calculate the 95% CIs if the outcomes are dichotomous and the
investigators report the actual rates of events, as in the example
above, by using the calculator available at: Also, see our web
links for other sources (search “confidence intervals”): References:
|
||||||||||||||||||||||||||||||||
A Cautionary Tale of Harms versus
Benefits: Misleading Findings Due to Potentially Inadequate
Data Capture — Approtinin Example Assessing safety of interventions is frequently challenging for many reasons, and it is made even more so when data is missing. It is easy to draw conclusions about the clinical usefulness of new interventions from studies that have only limited outcome measures without noticing what is missing. Aprotinin is a recent example of a drug which was approved by the FDA on the basis of reduced bleeding in coronary artery bypass graft (CABG) surgery and which was quickly adopted by surgeons, but with what now appears to be outcomes of greater harms than benefits. There now appears to be increased mortality in patients receiving aprotinin even though there is a decreased need for blood transfusions. Aprotonin received FDA approval in 1993 for use in CABG surgery to decrease blood loss. However, observational studies in 2006 and 2007 reported increased mortality with aprotinin [1,2], A 2007 Cochrane Review [3] of 211 RCTs reported that patients receiving aprotinin were less likely to have red blood cell transfusions than were those receiving lysine analogues, tranexamic acid (TXA), and epsilon aminocaproic acid (EACA). When the pooled estimates from the head-to-head trials of the two lysine analogues were combined and compared to aprotinin alone, aprotinin appeared superior in reducing the need for red blood cell transfusions: RR 0.83 (95% CI 0.69 to 0.99). The Cochrane review concluded that aprotinin may be superior to the lysine analogues TXA and EACA in reducing blood loss and the need for transfusion of red cells in patients undergoing cardiac surgery. The Cochrane review, however, was limited by inclusion of what appear to be studies with limited or no mortality reporting. In contrast, in May 2008, the Blood Conservation Using Antifibrinolytics in a Randomized Trial (BART) study [4] which compared massive postoperative bleeding rates in patients treated with aprotinin versus those treated with the lysine analogues tranexamic acid and aminocaproic acid in patients undergoing high-risk cardiac surgery, reported decreased massive bleeding, but increased mortality in patients receiving aprotinin. The trial was terminated early because of a higher rate of death at 30 days in patients receiving aprotinin.
The authors concluded that —
Delfini Comments Given a potential relative risk of roughly as high as 2 (meaning that those receiving aprotinin may have as high as a roughly 2 times greater likelihood of death than those receiving lysine analogues), it is likely that aprotinin will no longer be used in high-risk and perhaps all cardiac surgery based on the BART study because of what appears to be increased mortality with aprotinin not seen with the lysine analogues. And so what possibly explains this conflict in findings? While it is possible that the results in the BART study are due to chance, that seems unlikely given a) the previously observed findings in the 2006 and 2007 observational studies, and b) the consistency of results in comparing aprotinin against each agent.
And so what can a diligent reader do? Our advice is carefully consider whether primary and secondary outcomes in clinical trials are sufficient in terms of providing evidence regarding benefits and risks. If outcome measures are few and are all from small studies or meta-analyses of small studies, it is possible that clinically important harms will not be detected. Uncertainty is reduced when large RCTs confirming results of earlier, smaller studies become available--or as in the case of aprotinin—when a large RCT identified meaningful adverse events. References 1. Mangano DT, Tudor IC, Dietzel C. The risk associated with aprotinin in cardiac surgery. N Engl J Med 2006;354:353-65. 2. Mangano DT,
Miao Y, Vuylsteke A, et al. Mortality associated with aprotinin
during 5 years following 3. Henry DA, Carless PA, Moxey AJ, et al. Anti-fibrinolytic use for minimising perioperative allogeneic blood transfusion. Cochrane Database Syst Rev 2007;4:CD001886. 4. Fergusson DA, Hébert PC, Mazer CD, et al. A comparison of aprotinin and lysine analogues in high-risk cardiac surgery. N Engl J Med 2008;358:2319-31.
|
||||||||||||||||||||||||||||||||
| When Is a Measure of Outcomes Like a Coupon for a Diamond Necklace? 03/20/2013 For those of you who struggle with the fundamental difference between absolute risk reduction (ARR) versus relative risk reduction (RRR) and their counterparts, absolute and relative risk increase (ARI/RRI), we have always explained that only knowing the RRR or the RRI without other quantitative information about the frequency of events is akin to knowing that a store is having a half-off sale—but when you walk in, you find that they aren't posting the actual price! And so your question is 50 percent off of what??? You should have the same question greet you whenever you are provided with a relative measure (and if you aren't told whether the measure is relative or absolute, you may be safer off assuming that it is relative). Below is a link to a great short cartoon that turns the lens a little differently and which might help. However, we will add that, in our opinion, ARR alone isn't fully informative either, nor is its kin, the number-needed-to-treat or NNT, and for ARI, the number-needed-to-harm or NNH. A 5 percent reduction in risk may be perceived very differently when "10 people out of a hundred benefit with one intervention compared to 5 with placebo" as compared to a different scenario in which "95 people out of a hundred benefit with one intervention as compared to 90 with placebo." As a patient, I might be less likely to want to expose myself to side effects if it is highly likely I am going to improve without treatment, for example. Providing this full information--for critically appraised studies that are deemed to be valid--of course, may best provide patients with information that helps them make choices based on their own needs and requirements including their values and preferences. We think that anyone involved in health care decision-making—including the patient—is best helped by knowing the event rates for each of the groups studied—i.e., the numerators and denominators for the outcome of interest by group which comprise the 4 numbers that make up the 2 by 2 table which is used to calculate many statistics. Isn't it great when learning can be fun too! Enjoy!
|
||||||||||||||||||||||||||||||||
Obtaining Absolute Risk Reduction (ARR) and Number Needed To Treat (NNT) From Relative Risk (RR) and Odds Ratios (OR) Reported in Systematic Reviews Background Fortunately we are now seeing more meta-analyses reporting both the relative risks along with ARR and NNT. The key point is that meta-analyses almost always use relative effect measures (relative risk or odds ratio) and then (hopefully) re-express the results using absolute effect measures (ARR or NNT). You may see the term, "assumed control group risk" or "assumed control risk" (ACR). This frequently refers to risk in a control group or subgroup of patients in a meta-analysis, but could also refer to risk in any group (i.e., patients not receiving the study intervention) being compared to an intervention group. The Cochrane Handbook now recommends that meta-analysts provide a summary table for the main outcome and that the table include the following items—
When RR is provided, ARR can easily be calculated. Odds ratios deal with odds and not probabilities and, therefore, cannot be converted to ARR with accuracy because odds cannot account for a number within a population—only how many with, for example, as compared to how many without. For more on "odds," see—http://www.delfini.org/page_Glossary.htm#odds Example 1: Antihypertensive drug therapy compared to control in elderly (60 years or older) for hypertension in the elderly Reference: Musini VM, Tejani AM, Bassett K, Wright JM. Pharmacotherapy for hypertension in the elderly. Cochrane Database Syst Rev. 2009 Oct 7;(4):CD000028. Review. PubMed PMID: 19821263.
Calculating the ARR and NNT from the Musini Meta-analysis
Computing ARR and NNT from Odds Ratios In some older meta-analyses you may not be given the assumed (ACR) risk. Example 2: Oncology Agent Assume a meta-analysis on an oncology agent reports an estimate of effect (mortality) as an OR of 0.8 over 3 years for a new drug. In order to do the calculation, an ACR is required. Hopefully this information will be provided in the study. If not, the reader will have to obtain the assumed control group risk (ACR) from other studies or another source. Let’s assume that the control risk in this example is 0.3.
Because of the limitations of odds ratios, as described above, it should be noted that when outcomes occur commonly (e.g., >5%), odds ratios may then overestimate the effect of a treatment. For more information see The Cochrane Handbook, Part 2, Chapter 12.5.4 available at http://www.cochrane-handbook.org/
|
||||||||||||||||||||||||||||||||
Early
Discontinuation of Clinical Trials: Oncology Medication Studies—Recent
Developments and Concern With the trend for more rapid approval of oncology drugs has come concern regarding the validity of reported results because of methodological problems. Validity and usefulness of reported results from oncology (and other) studies are clearly threatened by lack of randomization, blinding, the use of surrogate outcomes and other methodological problems. Trotta et al. have extended this concern in a recent study that highlights an additional problem with oncology studies—stopping ocncology trials early [1. Trotta F, Apolone G, Garattini S, Tafuri G. Stopping a trial early in oncology: for patients or for industry? Ann Oncol. 2008 Apr 9 [Epub ahead of print] PMID: 18304961].The aim of the study was to assess the use of interim analyses in randomized controlled trials (RCTs) testing new anticancer drugs, focusing on oncological clinical trials stopped early for benefit. A second aim was to estimate how often trials prematurely stopped as a result of an interim analysis are used for registration i.e., approval by European Medicines Agency (EMEA), the European equivalent of FDA approval. The authors searched Medline along with hand-searches of The Lancet, The New England Journal of Medicine, and The Journal of Clinical Oncology and evaluated all published clinical trials stopped early for benefit and published in the last 11 years. The focus was on anticancer drugs that contained an interim analysis. Results
and Authors’ Conclusions Surprisingly, there was a very small percentage of trials (approximately 4%) stopped early because of harms, i.e. serious adverse events. Therefore, toxicity does not represent the main factor leading to early termination of trials. Of the 25 trials, six had no data and safety monitoring board (DSMB) and five had enrolled less than 40% of the planned sample size. Even so, 11 were used to support licensing applications on the basis of what could have been exaggerated chance events. Thus, more than 78% of the oncology RCTs published in the last 3 years were used for registration purposes. The authors argue that only untruncated trials can provide a full level of evidence which might be useful for informing clinical practice decisions without further confirmative trials. They concluded that early termination may be done for ethical reasons such as minimizing the number of people given an unsafe, ineffective, or clearly inferior treatment. However, interim analyses may also have drawbacks, since stopping trials early for apparent benefit will systematically overestimate treatment effects [2. Pocock SJ. When (not) to stop a clinical trial for benefit. JAMA 2005; 294: 2228–2230. PMID: 16264167] and raises new concerns about what they describe as “market-driven intent.” Some additional key points made by the authors:
The authors conclude that:
Lancet
Comment Delfini
Comments
References
|
||||||||||||||||||||||||||||||||
Early Termination of Clinical Trials—2012 Update Several years ago we presented the increasing evidence of problems with early termination of clinical trials for benefit after interim analyses.[1] The bottom line is that results are very likely to be distorted because of chance findings. A useful review of this topic has been recently published.[2] Briefly, this review points out that—
The authors provide 3 examples to illustrate the above points where harm is likely to have occurred to patients. Case 1 is the use of preoperative beta blockers in non-cardiac surgery in 1999 a clinical trial of bisoprolol in patients with vascular disease having non-cardiac surgery with a planned sample size of 266 stopped early after enrolling 112 patients—with 20 events. Two of 59 patients in the bisoprolol group and 18 of 53 in the control group had experienced a composite endpoint event (cardiac death or myocardial infarction). The authors reported a 91% reduction in relative risk for this endpoint, 95% confidence interval (63% to 98%). In 2002, a ACC/AHA clinical practice guideline recommended perioperative use of beta blockers for this population. In 2008, a systematic review and meta-analysis, including over 12,000 patients having non-cardiac surgery, reported a 35% reduction in the odds of non-fatal myocardial infarction, 95% CI (21% to 46%), a twofold increase in non-fatal strokes, odds ratio 2.1, 95% CI (2.7 to 3.68), and a possible increase in all-cause mortality, odds ratio 1.20, 95% CI (0.95 to 1.51). Despite the results of this good quality systematic review, subsequent guidelines published in 2009 and 2012 continue to recommend beta blockers. Case 2 is the use of Intensive insulin therapy (IIT) in critically ill patients. In 2001, a single center randomized trial of IIT in critically ill patients with raised serum glucose reported a 42% relative risk reduction in mortality, 95% CI (22% to 62%). The authors used a liberal stopping threshold (P=0.01) and took frequent looks at the data, strategies they said were “designed to allow early termination of the study.” Results were rapidly incorporated into guidelines, e.g., American College Endocrinology practice guidelines, with recommendations for an upper limit of glucose of </=8.3 mmol/L. A systematic review published in 2008 summarized the results of subsequent studies which did not confirm lower mortality with IIT and documented an increased risk of hypoglycemia. Later, a good quality SR confirmed these later findings. Nevertheless, some guideline groups continue to advocate limits of </=8.3 mmol/L. Other guidelines utilizing the results of more recent studies, recommend a range of 7.8-10 mmol/L.15. Case 3 is the use of activated protein C in critically ill patients with sepsis. The original 2001 trial of recombinant human activated protein C (rhAPC) was stopped early after the second interim analysis because of an apparent difference in mortality. In 2004, the Surviving Sepsis Campaign, a global initiative to improve management, recommended use of the drug as part of a “bundle” of interventions in sepsis. A subsequent trial, published in 2005, reinforced previous concerns from studies reporting increased risk of bleeding with rhAPC and raised questions about the apparent mortality reduction in the original study. As of 2007, trials had failed to replicate the favorable results reported in the pivotal Recombinant Human Activated Protein C Worldwide Evaluation in Severe Sepsis (PROWESS) study. Nevertheless, the 2008 iteration of the Surviving Sepsis guidelines and another guideline in 2009 continued to recommend rhAPC. Finally, after further discouraging trial results, Eli Lilly withdrew the drug, activated drotrecogin alfa (Xigris) from the market 2011. Key points about trials terminated early for benefit:
References 1. http://www.delfini.org/delfiniClick_PrimaryStudies.htm#truncation 2. Guyatt GH, Briel M, Glasziou P, Bassler D, Montori VM. Problems of stopping trials early. BMJ. 2012 Jun 15;344:e3863. doi: 10.1136/bmj.e3863. PMID:22705814.
|
||||||||||||||||||||||||||||||||
Advanced
Concepts: Can Useful Information Be Obtained From Studies With
Significant Threats To Validity? A Case Study of Missing Data
Points in Venous Thromboembolism (VTE) Prevention Studies &
A Case Study of How Evidence from One Study Might Support Conclusions
from a Flawed Study We approach critical appraisal of the medical literature by applying critical appraisal concepts coupled with critical thinking. This requires a movement from the general to the very particular circumstances before us. Paraphrasing from — is it Voltaire?; along with one of our favorite medical leaders, Dr. Tim Young — “It is important to keep perfection from being the enemy of the good.” Ultimately, the goal of doing critical appraisal work is not to “pass” or “fail” studies, but to help predict, for example, the effect of an intervention on outcomes of interest, based on what we can glean as possible explanations for the observed outcomes. Understanding critical appraisal concepts is necessary to conceive of possible explanations. Critical appraisal is not and should not be a mere recording of tick marks on a checklist or earning points on a quality scale. Despite attempts of various groups to do so, we maintain that the reliability and usefulness of a study cannot be “scored” through such a system. Moher has pointed out a number of shortcomings of “scales” designed to quantitate the likelihood of freedom from bias in clinical trials.[1] It requires reflective thought to determine why we might see a particular outcome — and this is wholly dependent upon a variety of factors including the population, the circumstances of care, threats to validity in applying critical appraisal concepts and more. It is also important to keep in mind that failing a critical appraisal screening does NOT mean something doesn’t work. Furthermore, it is important to understand that sometimes — despite “failing” a critical appraisal for research design, execution or reporting — a study will, in fact, give us evidence that is reasonable to rely upon. Our Venous Thromboembolism (VTE) Prevention story is a case in point. Recently we assisted Kaiser Permanente Hawaii in developing a standardized, evidence based VTE prophylaxis guideline for the known high risk total knee and hip replacement population.
Our key questions were as follows:
There are several interesting lessons this project taught us about applying general critical appraisal concepts to individual trials and keeping one’s eye focused on the true goal behind the concepts. Firstly, in much of the literature on VTE and DVT prophylaxis, the rates for missing venogram data are very high — frequently this is as high as 40 percent. Delfini’s stance on missing data is that even a small drop-out rate or percent of missing data can threaten validity.[2,3] But it is the reason for the missing data rates that is truly what matters. A fundamental issue in critical appraisal of clinical trials is that there can be no difference between the groups being studied since it is that difference that may account for the difference in outcomes. As stated above, in examining multiple studies of VTE prophylaxis in THR and TKR surgery, we found a high percentage of studies had missing venogram information. It appears that patients and their clinicians frequently chose to omit the final venogram despite a study protocol requiring a venogram for assessing DVT rates. From a clinical standpoint and a patient perspective, this makes perfect sense. For example, most patients in the study will be asymptomatic and there are risks associated with the procedure. In addition undergoing a venogram is inconvenient (e.g., creating a delay in hospital discharge). So the key question becomes — do the groups differ with respect to the missing data? Success of concealed allocation, blinding and comparable rates of missing data are all validity detection clues to help ensure it is unlikely that the groups were different or treated differently. In our review of the data, we think that it may be reasonable to conclude that a decision to have a final venogram was independent of anything about the interventions and prognostic variables in the two groups and unlikely to be the factor responsible for different DVT rates in the groups. A different, yet an interesting challenge with the Westrich study revolved around the scientific evidence on compression devices.[4] This study reported the overall incidence of deep vein thrombosis (DVT) rates in total knee replacement (TKR) surgery rates in mechanical compression plus enoxaparin versus mechanical compression plus aspirin (ASA). Our original grading of this study (partly due to problems in study reporting) was Grade U: Uncertain Validity. Delfini almost never utilizes a Grade U study for questions of efficacy. [NB: Following discussions with the author, clarifying certain questions, the study was upgraded to Grade BU: Possible to uncertain usefulness using the Delfini Evidence Grading System.] However, upon careful review and reasoning, and armed with evidence from another Grade BU study, Haas, which studied aspirin alone for VTE prophylaxis, our team was able to deduce that the results of Westrich were likely to be valid and useful.[5] Here is
our summation of the Westrich results:
Here is our reasoning as to why the Westrich results are likely to be reliable:
At times it makes sense to grade individual study conclusions. Documentation of reasons is always important and required as good evidence-based practice. Bottom Line: It is important to understand critical appraisal concepts, and it is important to critically appraise studies. The goal, however, is getting close to truth. Doing so requires critical thinking as well about the unique circumstances of each study and each study topic. References 2. Strite SA, Stuart ME, Urban S. Process steps and suggestions for creating drug monographs and drug class reviews in an evidence-based formulary system. Formulary. April 2008;43:135–145. 3. Delfini Group White Paper — Missing Data: Considerations 4. Westrich GH, Bottner F, Windsor RE, Laskin RS, Haas SB, Sculco TP. VenaFlow plus Lovenox vs VenaFlow plus aspirin for thromboembolic disease prophylaxis in total knee arthroplasty. J Arthroplasty. 2006 Sep;21(6 Suppl 2):139-43. PMID: 16950076 5. Haas SB, Insall JN, Scuderi GR, et al. Pneumatic sequential compression boots compared with aspirin prophylaxis of deep-vein thrombosis after total knee arthroplasty. J Bone Joint Surg Am 1990; 72:27–31. PMID: 2404020
|
||||||||||||||||||||||||||||||||
Review of Bias In Diabetes Randomized Controlled Trials Healthcare professionals must evaluate the internal validity of randomized controlled trials (RCTs) as a first step in the process of considering the application of clinical findings (results) for particular patients. Bias has been repeatedly shown to increase the likelihood of distorted study results, frequently favoring the intervention. Readers may be interested in a new systematic review of diabetes RCTs. Risk of bias (low, unclear or high) was assessed in 142 trials using the Cochrane Risk of Bias Tool. Overall, 69 trials (49%) had at least one out of seven domains with high risk of bias. Inadequate reporting frequently hampered the risk of bias assessment: the method of producing the allocation sequence was unclear in 82 trials (58%) and allocation concealment was unclear in 78 trials (55%). There were no significant reductions in the proportion of studies at high risk of bias over time nor in the adequacy of reporting of risk of bias domains. The authors conclude that these trials have serious limitations that put the findings in question and therefore inhibit evidence-based quality improvement (QI). There is a need to limit the potential for bias when conducting QI trials and improve the quality of reporting of QI trials so that stakeholders have adequate evidence for implementation. The entire freely-available study is available at— http://bmjopen.bmj.com/content/3/4/e002727.long Ivers NM, Tricco AC, Taljaard M, Halperin I, Turner L, Moher D, Grimshaw JM. Quality improvement needed in quality improvement randomised trials: systematic review of interventions to improve care in diabetes. BMJ Open. 2013 Apr 9;3(4). doi:pii: e002727. 10.1136/bmjopen-2013-002727. Print 2013. PubMed PMID: 23576000.
|
||||||||||||||||||||||||||||||||
Comparative Study Designs: Claiming Superiority, Equivalence and Non-inferiority—A Few Considerations & Practical Approaches This is a complex area, and we recommend downloading our freely available 1-page summary to help assess issues with equivalence and non-inferiority trials. Here is a short sampling of some of the problems in these designs: lack of sufficient evidence confirming efficacy of referent treatment, ("referent" refers to the comparator treatment); study not sufficiently similar to referent study; inappropriate Deltas (meaning the margin established for equivalence or non-inferiority); or significant biases or analysis methods that would tend to diminish an effect size and "favor" no difference between groups (e.g., conservative application of ITT analysis, insufficient power, etc.), thus pushing toward non-inferiority or equivalence. However, we do want to say a few more things about non-inferiority trials based on some recent questions and readings. Is it acceptable to claim superiority in a non-inferiority trial? Yes. The Food and Drug Administration (FDA) and the European Medicines Agency (EMA), among others, including ourselves, all agree that declaring superiority in a non-inferiority trial is acceptable. What's more, there is agreement that multiplicity adjusting does not need to be done when first testing for non-inferiority and then superiority. See Delfini Recommended Reading: Included here is a nice article by Steve Snapinn. Snapinn even recommends that "…most, if not all, active-controlled clinical trial protocols should define a noninferiority margin and include a noninferiority hypothesis." We agree. Clinical trials are expensive to do, take time, have opportunity costs, and—most importantly—are of impact on the lives of the human subjects who engage in them. This is a smart procedure that costs nothing especially as multiplicity adjusting is not needed. What does matter is having an appropriate population for doing a superiority analysis. For superiority, in studies with dichotomous variables, the population should be Intention-to-Treat (ITT) with an appropriate imputation method that does not favor the intervention under study. In studies with time-to-event outcomes, the population should be based on the ITT principle (meaning all randomized patients should be used in the analysis by the group to which they were randomized) with unbiased censoring rules. Confidence intervals (CIs) should be evaluated to determine superiority. Some evaluators seem to suggest that superiority can be declared only if the CIs are wholly above the Delta. Schumi et al. express their opinion that you can declare superiority if the confidence interval for the new treatment is above the line of no difference (i.e.., is statistically significant). They state, “The calculated CI does not know whether its purpose is to judge superiority or non-inferiority. If it sits wholly above zero [or 1, depending upon the measure of outcome], then it has shown superiority.” EMA would seem to agree. We agree as well. If one wishes to take a more conservative approach, one method we recommend is to judge whether the Delta seems clinically reasonable (you should always do this) and if not, establishing your own through clinical judgment. Then determine if the entire CI meets or exceeds what you deem to be clinically meaningful. To us, this method satisfies both approaches and makes practical and clinical sense. Is it acceptable to claim non-inferiority trial superiority? It depends. This area is controversial with some saying no and some saying it depends. However, there is agreement amongst those on the "it depends" side that it generally should not be done due to validity issues as described above. References European Agency for the Evaluation of Medicinal Products Committee for Proprietary Medicinal Products (CPMP): Points to Consider on Switching Between Superiority and Non-Inferiority. 2000. http://www.ncbi.nlm.nih.gov/pmc/articles/PMC2014556/ http://www.delfini.org/delfiniReading.htm#equivalence
|
||||||||||||||||||||||||||||||||
Are Adaptive Trials Ready For Primetime? It is well-known that many patients volunteer for clinical trials because they mistakenly believe that the goal of the trial is to improve outcomes for the volunteers. A type of trial that does attempt to improve outcomes for those who enter into the trial late is the adaptive trial. In adaptive trials investigators change the enrollment and treatment procedures as the study gathers data from the trial about treatment efficacy. For example, if a study compares a new drug against a placebo treatment and the drug appears to be working, subjects enrolling later will be more likely to receive it. The idea is that adaptive designs will attract more study volunteers. As pointed out in a couple of recent commentaries, however, there are many unanswered questions about this type of trial. A major concern is the problem of unblinding that may occur with this design with resulting problems with allocation of patients to groups. Frequent peeks at the data may influence decisions made by monitoring boards, investigators and participants. Another issue is the unknown ability to replicate adaptive trials. Finally, there are ethical questions such as the issue of greater risk for early enrollees compared to risk for later enrollees. For further information see— 1. Adaptive Trials in Clinical Research: Scientific and Ethical Issues to Consider 2. Adaptive Clinical Trials: A Partial Remedy for the Therapeutic Misconception?
|
||||||||||||||||||||||||||||||||
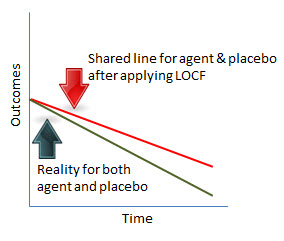
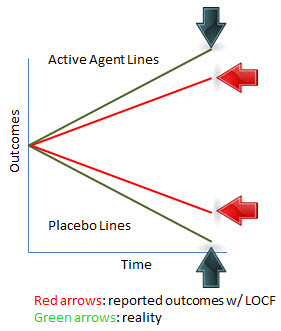
At DelfiniClick™
|
Menu........
Use of our website implies agreement to our Notices. Citations for references available upon request.
Home
Best of Delfini
What's New
Blog
Seminars
Services
Delfini Group Publishing
Resources
Sample Projects
Notices
About
Us & Our Work
Testimonials
Other
Site Search
Contact
Info/Updates
........
Quick Navigator to Selected Resources
- Tools & Educational Library
- The Healthcare Information Problem
- Tutorials
- DelfiniClick™—commentaries
- On the Same Page™—patient decision support
- Evidence Messaging Scripts
- Delfini Publications
- Medical Leader Interviews
- Glossary
- Recommended Reading
- Recommended Web Links
- Delfini Critical Appraisal Flier
- Get DelfiniGram™ Updates
.......................
.