
Evidence- and Value-based Solutions for Health Care™
Clinical Improvement Consults, Content Development, Training & Seminars, Tools
Flowing Evidence into Cost Analysis: Powerful Ways with Number-needed-to-treat (NNT)
The EBM Information Quest: Is it true? Is it useful? Is it usable?™
Delfini Co-founders: Michael E Stuart MD, President & Medical Director . Sheri Ann Strite, Managing Director & Principal

Why Critical Appraisal Matters


DelfiniClick™Evidence & Quality Improvement Commentaries |
Follow & Share...
Just-in-time Updates![]()
Like Us ![]() Find Us
Find Us![]()
DelfiniGram™: GET ON OUR UPDATE LIST ![]()
Cost Analysis & NNT Example
This example serves several purposes.
- It illustrates the critical importance of including time period in NNT in order to better understand efficacy.
- It shows how you can use NNT in an effectiveness and cost analysis.
1. Read the fictional scenario below. This is typical of the kinds of issues faced by doctors, P & T committees, QI staff, etc., daily.
2. Think about your reaction.
3. Then look at the graphic to see how important NNT can be. Remember, NNT is always to be associated the length of the time of study. This example drives this home.
Fictional Scenario
- Lifetime risk of hip fracture in women is 15% with significant mortality (20-30% of women die in the first year following hip fracture).
- HRT is now found to have many risks. Other fracture prevention drugs have risks. There is a new (fictional) drug on the market that has fewer risks and that many docs are starting to use on high and moderate risk women. The drug is getting a lot of press attention and has good evidence behind it.
- Many women in your organization are requesting information and treatment for prevention of fractures. Many are asking about this new drug.
- One year of treatment is cheaper than alendronate.
Should you treat these women with this new drug? How do you decide?
Discussion
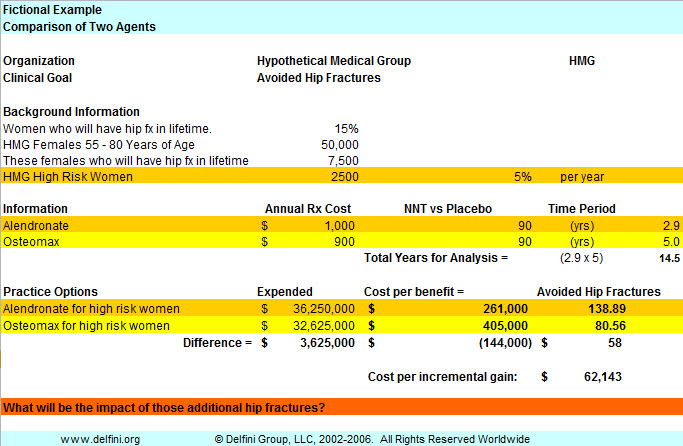
In our fictional scenario, by switching from our current care to our new drug, we will have done the following:
- Significantly reduced quality of care. We will now prevent roughly 80 hip fractures compared to roughly 138 prevented with current treatment in a course of 14.5 years.
- Significantly increased our expenses. We will now have spent $3.6MM less in prevention treatment, but will have significant new expenses due to the increase in hip fractures.
This examples shows several things:
- You can do a simple, yet powerful "back-of-the-envelope" analysis using a spreadsheet tool.
- You need to look at prevalence data in your population, consider what you are currently doing, assess the evidence and then do sensitivity analyses to explore potential impacts of practice change.
- Flowing evidence into your cost analysis is highly important and revealing. In this instance we see that even though a new drug may be less expense per year of treatment, we are actually significantly reducing our quality of care AND increasing our expenses by making a switch.
- Many times people talk about NNT without including the appropriate associated time period. We see by this example, that it is this difference in time periods between the old agent and the new that has made the significant difference.
To compute a cost per benefit, which you can then use for comparison purposes:
Quick Equation #1: NNT x study period x dollars per time unit
OR #2: NNT x study period cost
........
At Cost Analysis & NNT

Menu........
Use of our website implies agreement to our Notices. Citations for references available upon request.
Home
Best of Delfini
What's New
Blog
Seminars
Services
Delfini Group Publishing
Resources
Sample Projects
Notices
About
Us & Our Work
Testimonials
Other
Site Search
Contact
Info/Updates
........
Quick Navigator to Selected Resources
- Tools & Educational Library
- The Healthcare Information Problem
- Tutorials
- DelfiniClick™—commentaries
- On the Same Page™—patient decision support
- Evidence Messaging Scripts
- Delfini Publications
- Medical Leader Interviews
- Glossary
- Recommended Reading
- Recommended Web Links
- Delfini Critical Appraisal Flier
- Get DelfiniGram™ Updates
.......................